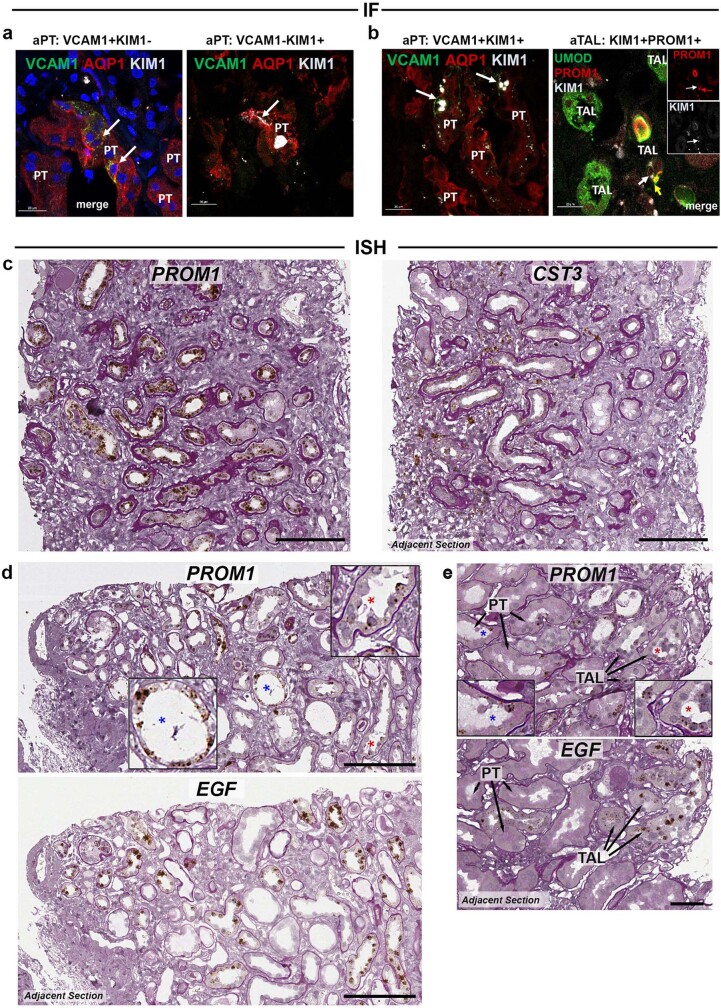
Extended Data Fig. 10. Adaptive epithelia localized to areas of injury.
a. Immunofluorescent (IF) staining of VCAM1, AQP1, KIM1 (HAVCR1) in the aPT (performed on replicate sections from 3 individuals). Scale bars represent 20 µm. b. IF staining of UMOD, PROM1 and KIM1 in the TAL (performed on replicate sections from 3 individuals). Scale bars represent 20 µm. c-e. RNA in situ hybridization (ISH) for PROM1, CST3 or EGF (performed on adjacent sections from 6 individuals). c. ISH for PROM1 and CST3 in adjacent sections. PROM1 is localized to an area showing interstitial fibrosis and tubular atrophy. Scale bar is 100 μm. d. RNA ISH for PROM1 (left panel) and EGF (right panel) in adjacent corticomedullary sections. PROM1 positive epithelial cells seen in injured tubules (epithelial simplification, loss of nuclei) that are EGF negative (blue asterisks, upper inset image) and EGF positive healthy TAL (red asterisks, lower inset image). Scale bar is 100 μm. e. ISH for PROM1 and EGF (healthy TAL) showing PROM1 localization to PT (blue asterisks, left inset) and TAL (red asterisks, right inset) showing histological evidence of injury (epithelial thinning, nuclei loss, brush border loss in PT). Adjacent section (lower panel) shows EGF positivity in healthy TAL cells. Scale bar is 50 μm.

