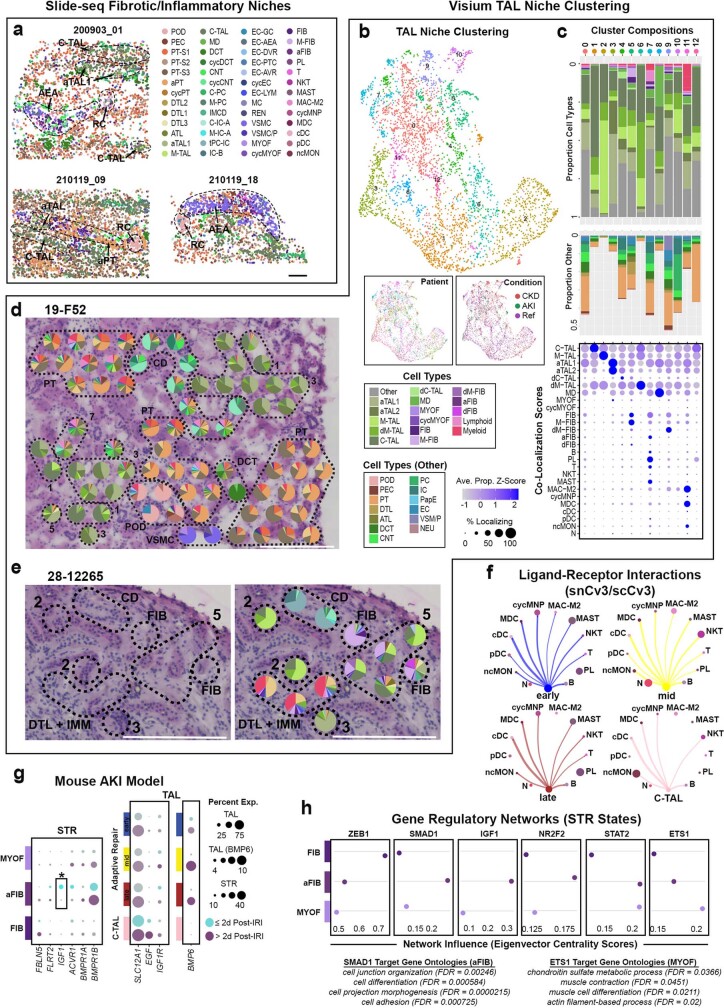
Extended Data Fig. 11. TAL adaptive or maladaptive repair niches.
a. Slide-seq fibrotic/inflammatory niches from Fig. 5d showing full predicted subclass level 3 cell type distributions. Scale bar is 100 μm. b. Visium TAL niches were identified by clustering TAL dominant spots according to Seurat label transfer scores. The UMAP denotes 13 TAL niches which were distributed across the 23 samples (patient inset) and across disease state conditions (condition inset). c. Visium niche cluster compositions. Signature proportions of TAL cell types, injury cell states, stromal cells, and immune cells. Niche 5 contained significant stromal, niche 7 contained lymphoid, and niche 11 contained myeloid cell signatures. Some niches (e.g. 9) had significant contributions from neighbouring non-TAL epithelial cells (“Proportion Other” bar plot). The colocalization score (Methods) for cell types within each niche is based on Seurat label transfer scores and provided as a dot plot. d. A subset of TAL niches (1, 3, 5, 7) were overlaid upon a histologic image of the cortex in sample M19-F52_3, with each niche often represented by multiple contiguous spots. Scale bar is 300 μm in length. e. Representative region (patient 28-12265) showing niche 5 (STR) localized in proximity to interstitial fibrosis, and niche 3 (aTAL) localized adjacent to myeloid cell infiltration. Scale bar is 300 μm. f. Circle plot of ligand-receptor cell cell communications between TAL repair modules or states and immune cell subclasses. Dot size indicates relative proportion of the subclasses and TAL module, edge width represents strength of the communication. g. Dotplots showing expression level and percent expressed for select ligands or receptors within the mouse AKI data. Data were grouped into injury groups less than or equal to 2 days (including control cells) and groups greater than 2 days post-injury. The asterix highlights an IGF1 expression difference found between early and late injury groups of the aFIB population. h. Gene regulatory networks associated with STR cell types (see Supplementary Table 27). Eigenvector centrality scores were plotted for select factors with high influence on different subclasses. Ontologies for target genes downstream of select transcription factors are shown.

