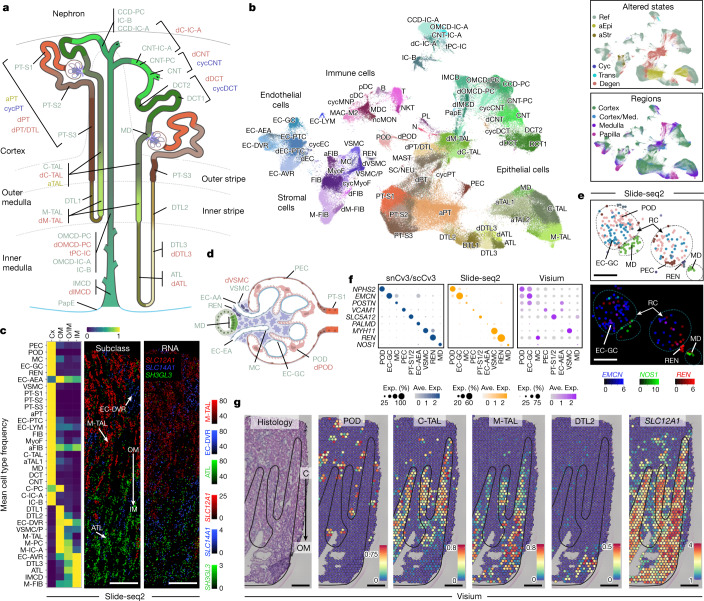
Fig. 2. Spatially resolved atlas of molecular cell types.
a, Schematic of the human nephron showing cell types and states. b, UMAP embedding showing cell types (subclass level 3) for snCv3. Insets: overlays for both regional origin and altered-state status. Cyc, cycling; degen, degenerative; trans, transitioning. See Supplementary Table 4 for cell type definitions. c, Heat map of Slide-seq cell type frequencies along the corticomedullary axis (three individuals) (left). Middle, representative tissue puck region showing the transition of ATL to M-TAL segments. Right, corresponding expression of marker genes (scaled). Scale bar, 300 µm. d, Schematic of the renal corpuscle showing resolved cell types. e, The Slide-seq puck area indicated in Extended Data Fig. 4c and predicted cell types for renal corpuscles (top). Bottom, mapped expression values for corresponding marker genes (scaled). Scale bar, 100 µm. f, The average expression values for renal corpuscle cell types for markers shown in e and Extended Data Fig. 4f for all datasets. Ave., average; Exp., expression. g, Visium data on a healthy reference kidney (cortex, top; medulla, bottom). Left, haematoxylin and eosin (H&E)-stained tissue. Right, the per-bead predicted transfer scores for cell types or transcript expression values. Scale bar, 300 µm. Cx, cortex; OM, outer medulla; IM, inner medulla. The black lines outline histologically confirmed medullary rays leading into medulla.

