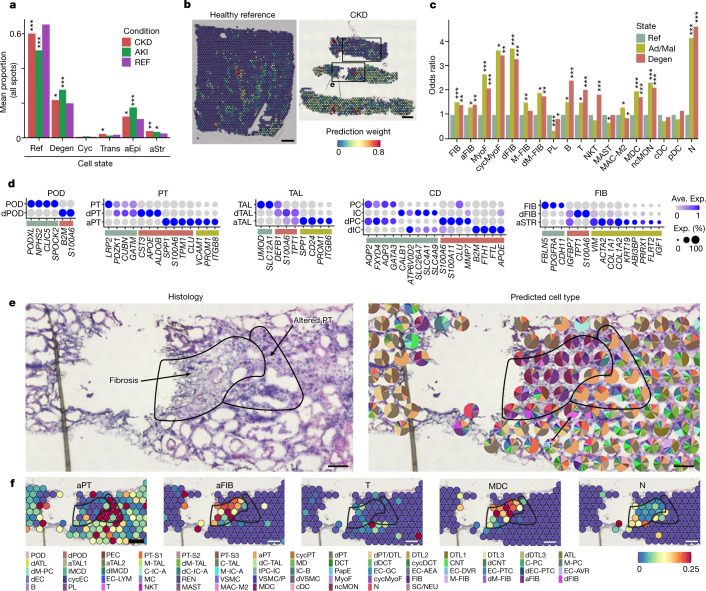
Fig. 3. Transcriptomically defined injury neighbourhoods.
a, The mean proportion of altered-state expression signatures (see Methods, 10x Visium spatial transcriptomics) for all Visium spots (146,460 total spots over 22 individuals). P values were calculated using Fisher’s exact tests over the spot proportions. b, Feature plots of the aEpi cell state. Scale bar, 300 µm. The top bounded region is shown in Extended Data Fig. 7h. c, Colocalization of immune and stromal cells with epithelial cell injury states. The y axis shows the odds ratio of colocalization (40,326 total spots over 22 individuals). P values were calculated using Fisher’s exact tests over the colocalization events. Ad/Mal, adaptive/maladaptive representing successful or maladaptive tubular repair. d, The average expression values for healthy reference and altered-state markers across cell types identified using Visium. e, Histology and predicted cell types in a cortical region (CKD) of interstitial fibrosis and neighbouring PT atrophy (altered PT). The pie charts show the proportions of predicted transfer scores for cell type annotations from snCv3 (Fig. 2b). The area corresponds to the bottom bounded region in b. Scale bar, 100 µm. f, The per-bead predicted transfer scores for cell types for area shown in e. Scale bar, 100 µm. *P < 0.01, **P < 1 × 10⁻⁵, ***P < 1 × 10⁻¹⁰. Exact P values are provided with the Source Data.

