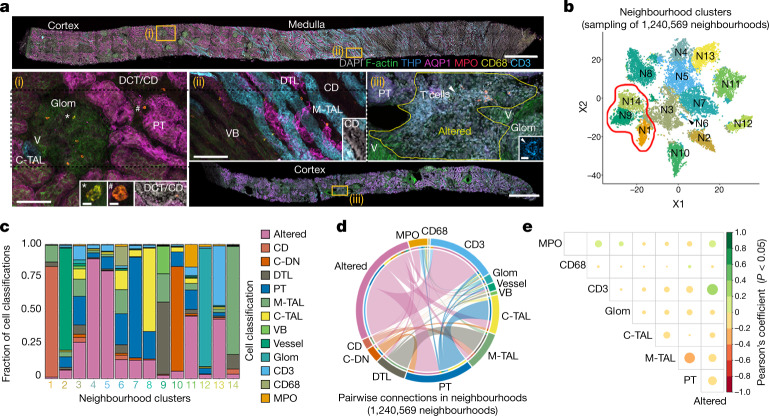
Fig. 4. Defining cellular niches in renal disease from 3D fluorescence imaging.
a, Maximum-intensity projections of representative biopsies (cortex or medulla) showing classification label examples (insets i–iii). Altered, altered morphology or injury; C-DN, cortical distal nephron; Glom, glomeruli; V, vessels; VB, vascular bundle. Examples of MPO+ and CD68+ are indicated (i). The symbols * and # indicate CD68+ and MPO+ cells, respectively, in (i) and insets. Arrowhead indicates T cell in (iii) and inset. Scale bars, 1 mm (biopsy images), 100 μm (i and ii) and 5 μm (insets). b, Community-based clustering on cell composition for around 20,000 randomly chosen neighbourhoods (15 individuals). The red outline indicates neighbourhoods including the medulla. c, The cellular composition of the neighbourhoods identified in b. d, Pairwise analysis of cells within 1.2 million neighbourhoods (15 individuals); colours are as indicated in c. e, Pearson’s coefficients for select interactions, the colour indicates both the value and direction of the correlation. P values were generated using two-sided t-tests.

