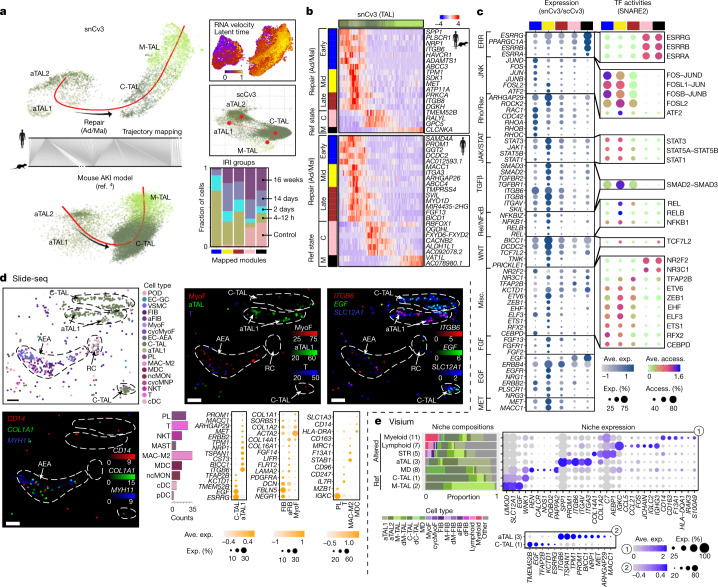
Fig. 5. Expression and regulatory signatures of adaptive epithelial cells.
a, Trajectory of TAL cells for snCv3, scCv3 and mouse AKI4 data, showing mouse to human mapping. Top right, latent time heat map from RNA velocity estimates. Bottom right, bar plot of collection groups after IRI across mouse trajectory modules. b, Heat map of smoothened gene expression (conserved or human specific) along the inferred TAL pseudotime. State modules based on the gene expression profiles are shown. M, M-TAL; C, C-TAL; Ad/Mal, adaptive/maladaptive, representing successful or maladaptive tubular repair. c, SNARE2 average accessibilities (access.) (chromVAR) and the proportion accessible for transcription-factor-binding sites (TFBSs) (right), and the averaged gene expression values (log scale) and the proportion expressed for integrated snCv3/scCv3 modules (left). TF, transcription factor. d, Slide-seq fibrotic regions. Top and bottom right, bead locations for a representative region, coloured by predicted subclasses, prediction weights or scaled gene expression values. Marker genes are ITGB6 (aTAL), EGF and SLC12A1 (TAL), CD14 (MAC-M2/MDC), MYH11 (VSMC/MyoF) and COL1A1 (aStr). The bar plot shows the immune subclass counts and the dot plots show the average expression of marker genes generated from three fibrotic regions (two individuals; Extended Data Fig. 11a). Scale bar, 50 μm. e, Visium TAL niches identified from all Visium spots and defined by colocalized cells (Methods and Extended Data Fig. 11b–e), showing the proportion of component cell type signatures. The dot plots show the niche marker gene average expression values.

