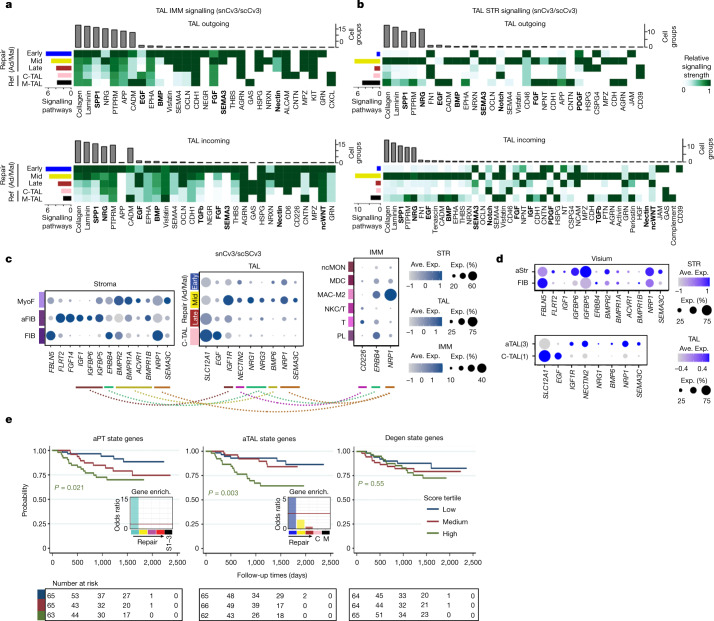
Fig. 6. Maladaptive repair signatures.
a,b, The ligand–receptor signalling strength between TAL states and IMM subclasses (a) or STR subclasses (b). The coloured bars indicate the total signalling strength of the cell group by summarizing signalling pathways. The grey bars indicate the total signalling strength of a signalling pathway by summarizing cell groups. Members of key signaling pathways described in the main text are in bold. c, The average gene expression values for select ligand–receptor combinations using snCv3/scCv3 integrated data. d, Dot plots validating select markers shown in c in the Visium data. e, Unadjusted Kaplan–Meier curves by cell state scores for composite of end-stage renal disease (ESRD) or for 40% drop in eGFR from time of biopsy in the NEPTUNE adult patient cohort (199 patients; Supplementary Table 30). Patients who reached the end point between screening and biopsy were excluded. Enrich., enrichment. P values calculated using log-rank tests for trend are shown (P = 0.021 (aPT), P = 0.003 (aTAL), P = 0.55 (degenerative)).

