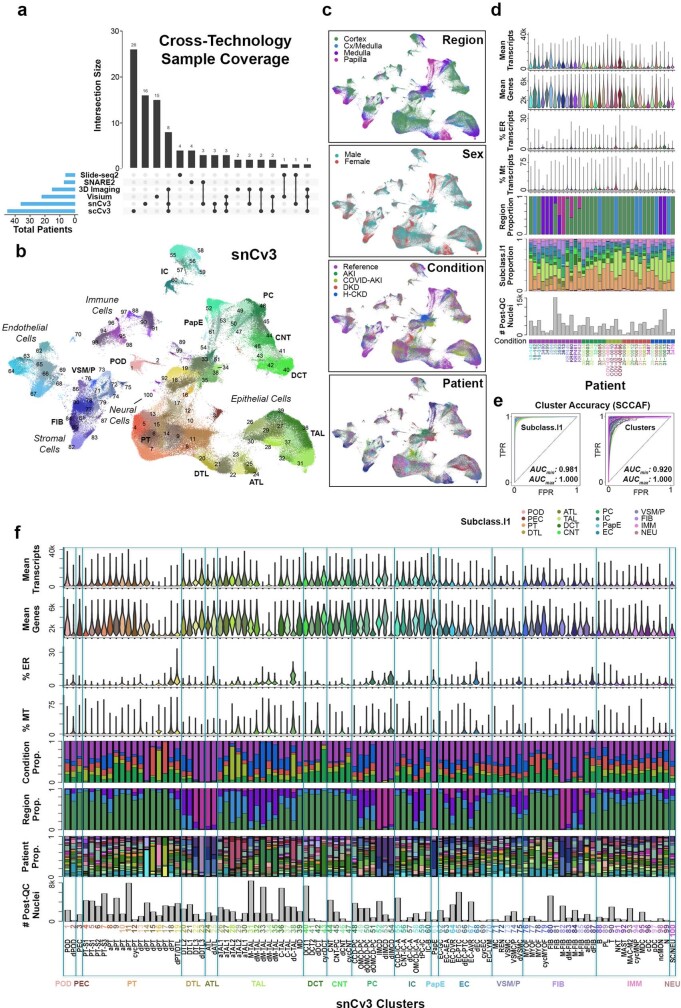
Extended Data Fig. 1. snCv3 cell types and quality metrics.
a. Number of samples processed across technologies assessed both individually and in combination. b. UMAP plots for snCv3 clusters. c. UMAP plots as in (b) showing the corresponding tissue regions, sex, patient identities and conditions. d. Bar and violin plots for snCv3 patients shown in (c). Barplots showing the total number of post-QC nuclei used in the snCv3 clustering analysis, and the proportions that were associated with level 1 subclasses, regions sampled or the health or disease conditions. Violin plots show the percentage of transcripts associated with the mitochondria (Mt) or endoplasmic reticulum (ER), as well as mean genes and mean transcripts detected per patient sample. e. Receiver operating characteristic (ROC) curve showing snCv3 clustering quality as assessed by the descrimination between subclasses (level 1) or clusters (b) using the Single Cell Clustering Assessment Framework (SCCAF). f. Bar and violin plots as in (d) for snCv3 clusters shown in (b), including proportion of nuclei contributed by each patient.

