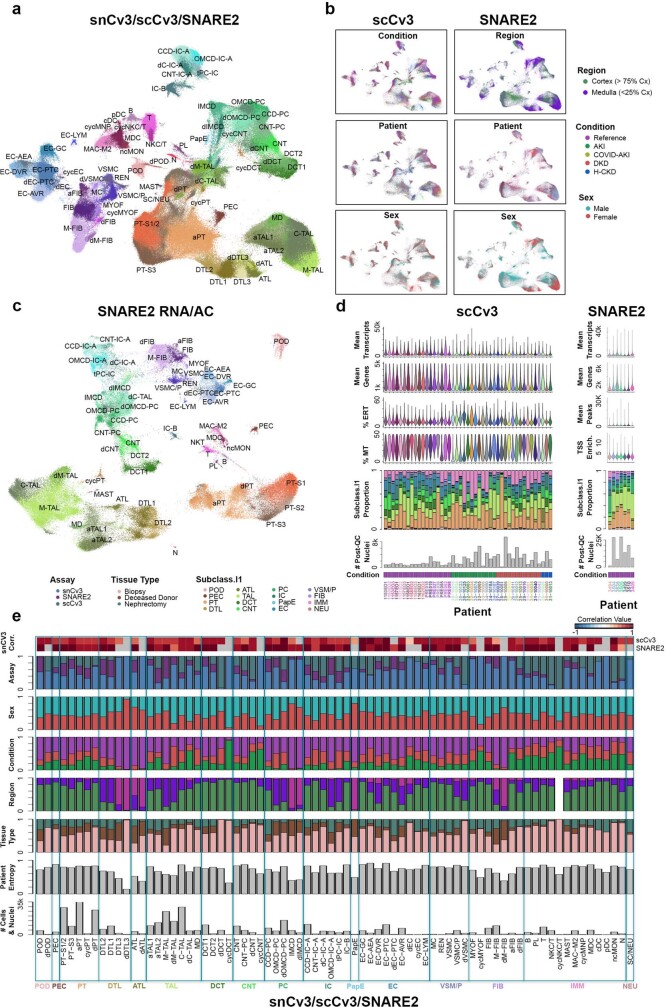
Extended Data Fig. 3. scCv3 integration and quality metrics.
a. UMAP plot showing integrated snCv3, scCv3 and SNARE2 (RNA) subclass level 3 annotations. scCv3 and SNARE2 (RNA) datasets were projected onto the snCv3 embeddings. b. UMAP plots as in (a) show mapping of the corresponding sex, patient identities and conditions for scCv3 and SNARE2 datasets. c. Joint embedding of SNARE2 RNA and AC modalities. d. Barplots showing the total number of post-QC nuclei and subclass level 1 cell types detected per scCv3 or SNARE2 patient. Violin plots show the percentage of transcripts associated with the mitochondria (Mt) or endoplasmic reticulum (ER), as well as mean genes, mean transcripts, mean accessible peaks or mean TSS enrichment scores detected per patient. e. Barplots showing the total number of post-QC nuclei/cells per subclass (level 3) combined across platforms (snCv3, scCv3, SNARE2). Patient entropy as well as tissue type, region, condition, sex and assay proportions are shown. Heatmap of correlation values for each scCv3 and SNARE2 subclass against the corresponding snCv3 subclass is shown (top panel). Grey values indicate absence of a comparison where subclasses were not covered by one or more of the technologies.

