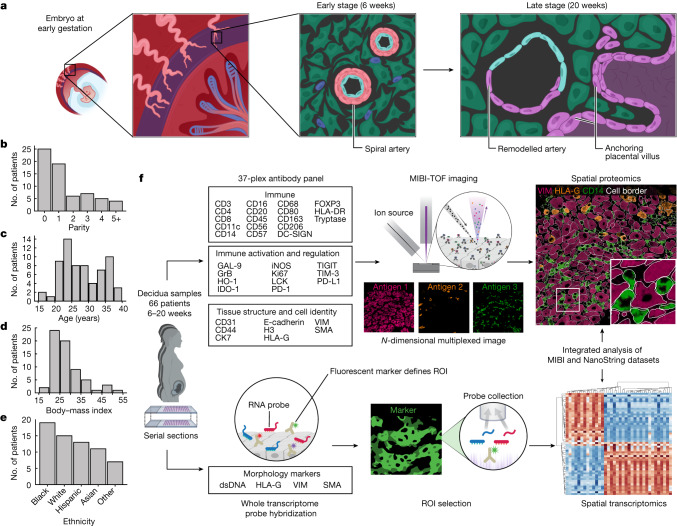
Fig. 1. Study design and workflow.
a, Diagram of a human embryo in utero at 6 weeks of gestation. Left, the maternal–fetal interface consisting of decidua basalis (purple) with maternal spiral arteries (light pink) and fetal chorionic villi in the intervillous space (bottom right corner). Middle and right, early-stage (6 weeks) unremodelled spiral artery and progression to late-stage (20 weeks) remodelled artery and anchoring fetal villi. b, Cohort parity distribution. c, Cohort age distribution. d, Cohort distribution of body–mass index. e, Cohort ethnicity distribution. f, TMA construction and serial sections for multiomics workflow. Top, antibody panel, MIBI acquisition and spatial proteomics data extraction. Bottom, morphology marker panel and probe diagram, NanoString DSP ROI selection and spatial transcriptomics data extraction. The schematics in f were created using BioRender (https://biorender.com).

