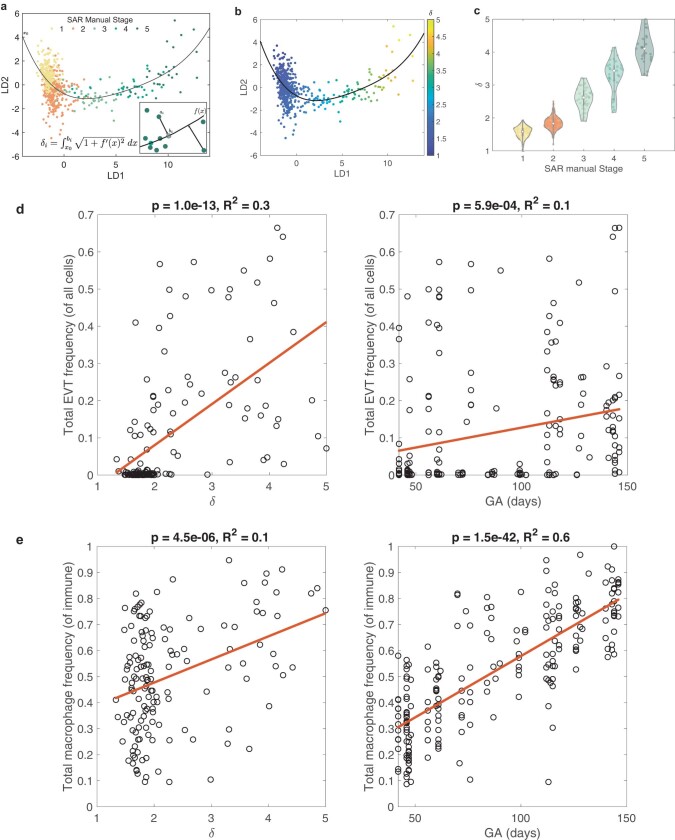
Extended Data Fig. 4. SAR trajectory.
a. Scatter of arteries in LDA space colored by manually-assigned stage. Polynomial fit: remodeling trajectory. Inset: matching each artery point ai to the SAR trajectory by finding the nearest point along trajectory bi. The continuous SAR score δ was then defined as the distance from origin x0 to bi along the trajectory curve. b. Scatter plot of arteries in LDA space colored by δ. c. Violins of artery δs by manual stage d,e. Scatter plots by δ (left) and GA (right) of EVT frequency out of all cells (d), macrophage frequency out of immune cells (e) Red lines, fitted linear regression, regression p-values on top.

