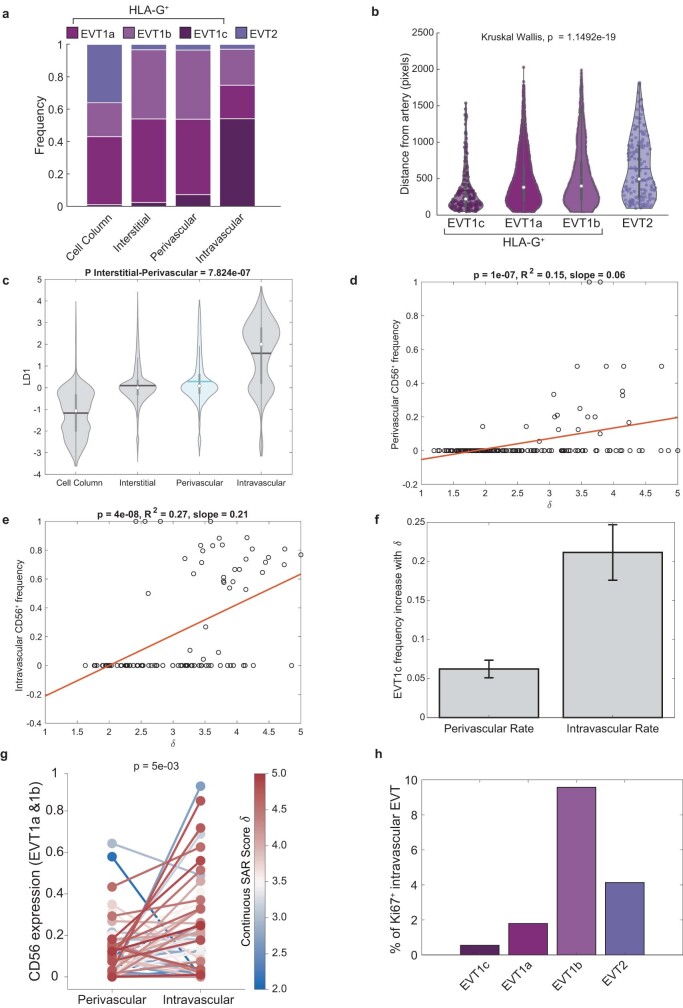
Extended Data Fig. 8. EVT Phenotype by Location.
a. Frequency of EVT populations by anatomical location. b. Violin plot of distance from artery (in pixels) by EVT type. EVT1c: N = 209, min = 12.8, max = 1536.7, center (median) = 173.9; EVT1a: N = 7123, min = 10, max = 2028.7, center = 363.6; EVT1b: N = 5908, min = 7.2, max = 1989.5, center = 376.45; EVT1c: N = 185, min= 9.4, max. = 1818.1, center = 475.6. c. Violin plot of the distribution of LD1 for EVTs, by anatomical location. Center lines inside violins indicate mean. Anchoring: N = 8906, min = −3.6, max = 3.9, center = −1; Interstitial: N = 38395, min = −3.4, max = 4.4, center = 0; Perivascular: N = 1097, min = −3.14, max = 4, center = 0.08; Intravascular: N=4040, min = −3.15, max = 4.6, center = 2. d-h: d,e Scatter plots of perivascular (d) and intravascular (e) EVT1c (CD56+) frequency by δ. Red lines, fitted linear regression, regression p-values on top. f. Bar plot of the EVT1c frequency increase rates (regression slopes from d,e). Error bars, 95% confidence interval for regression slopes. g. Paired-by-artery CD56 expression in EVT1a&b, between perivascular and intravascular compartments. Arteries with δ ≥ 2 included. p = 5e-03, one sided paired Wilcoxon signed rank test, z-statistic = 2.5 h. Proportion of Ki67+ intravascular EVT by type.

