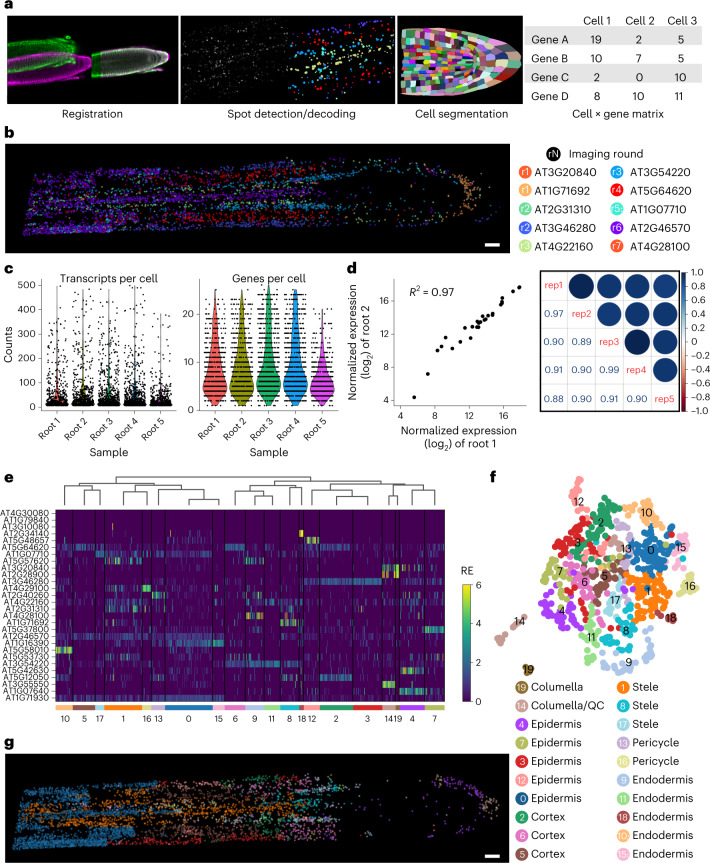
Fig. 2. Single-cell and spatial analysis of 28 genes with PHYTOMap.
a, PHYTOMap data analysis pipeline for single-cell analysis. b, 3D visualization of transcripts detected and decoded after image registration in a representative root tip (root 4). A middle section (z planes 90–120 of 208) of the image is displayed. Representative genes from each imaging round are shown. c, Violin plots showing the number of unique RNA molecules (left) and genes (right) detected in five root tip samples. d, Left, scatter plot comparing normalized bulk expression of each gene between two samples (root 1 and root 2). Right, correlation plot showing pair-wise correlation coefficients among five replicates. e, Hierarchical clustering of cells of root 4 based on the relative expression of 28 genes. Cluster IDs are indicated at the bottom. RE, relative expression. f, UMAP visualization of the clusters shown in e. g, 3D visualization of transcripts coloured by clusters in e and f in a representative root tip (root 4). A middle section (z planes 90–120 of 208) of the image is displayed. Scale bar, 25 μm (b,g).

