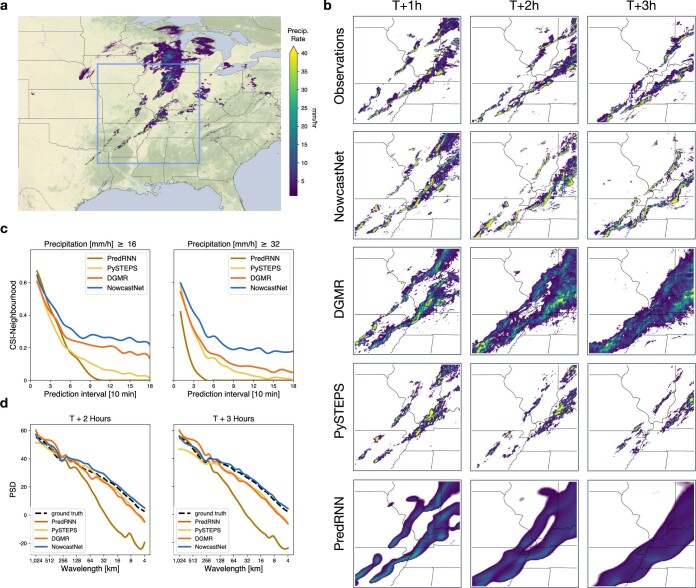
Extended Data Fig. 6. Case study of a precipitation event starting at 03:50 UTC on 11 December 2021, with a tornado outbreak that hit the central area around Tennessee.
NowcastNet gives detailed predictions on the movements and intensities of the two storms and yields a more accurate description of the motions of several supercells. a, Geographic context for the predictions. b, A single prediction at T + 1 h, T + 2 h and T + 3 h lead times for different models. c, CSI neighbourhood at thresholds 16 mm h−1 and 32 mm h−1. d, PSD at different wavelengths. Images are zoomed in 768 km × 768 km to highlight local details. Precipitation data obtained from the MRMS26 dataset and maps produced with cartopy and Natural Earth.

