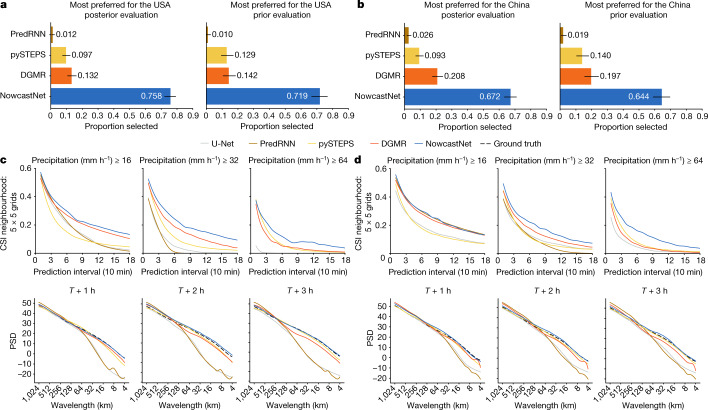
Fig. 4. Meteorologist evaluation and quantitative evaluation of the USA and China datasets.
a, Meteorologist evaluation for the USA events based on the first-choice preference of each model. Black horizontal lines indicate the Clopper–Pearson 95% confidence intervals. Meteorologists substantially preferred NowcastNet to other competitors (n = 62, P < 10−4). b, Meteorologist evaluation for the China events. Meteorologists substantially preferred NowcastNet to other competitors (n = 62, P < 10−4). c, Quantitative scores for the USA events in 2021. The first row shows CSI neighbourhood of different models at precipitation thresholds of 16 mm h−1, 32 mm h−1 and 64 mm h−1. The second row shows PSD over 1,024 km × 1,024 km predictions for different models at T + 1 h, T + 2 h and T + 3 h lead times. d, Quantitative scores for the China events from April 2021 to June 2021.

