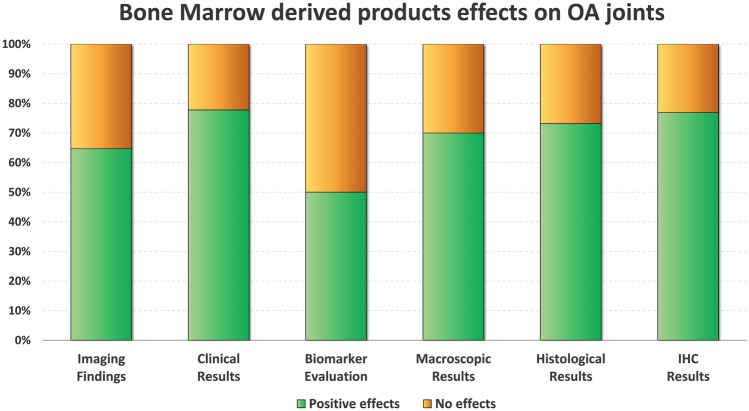
Fig. 3.
Disease-modifying effects on OA joints induced by bone marrow-derived products. The bar chart shows the percentage of studies that met the specific effects. Positive effects (green) vs no effects (orange) in imaging findings (n = 16), clinical results (n = 9), biomarker evaluation (n = 10), macroscopic results (n = 20), histological results (n = 21) and immunohistochemical results (n = 13). IHC immunohistochemistry; OA osteoarthritis

