Fig. 6.
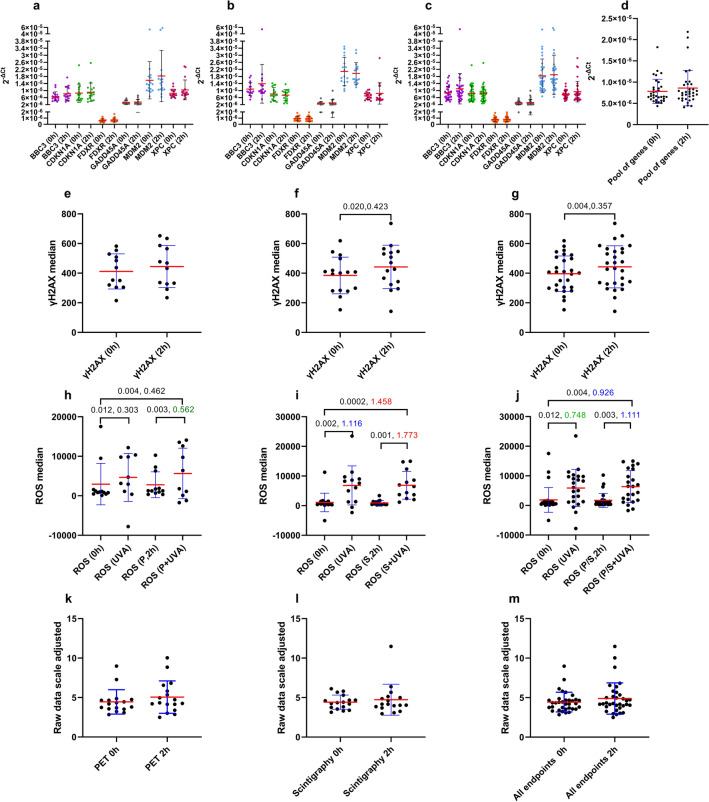
Raw data (2−ΔCt) at 0 and 2 h for PET (P) and scintigraphy (S) patients. Scatter dot plots representing 2−ΔCt gene expression for individual genes in PET patients (A), scintigraphy patients (B), pool of patients (C) and the pool of genes for all patients (D). Mean and standard deviations are represented by red and black bars, respectively (A–C), or by red and blue bars, respectively (D–I). Median γH2AX fluorescence intensity for PET patients (E), scintigraphy (F), or the pool of patients (G). Median ROS levels for PET patients (H), scintigraphy (I), or the pool of patients (J). ROS UVA: ROS after UVA exposure in 0 h samples. ROS P/S + UVA: ROS after UVA exposure in 2 h samples. Scatter dot plot for the average raw results of all endpoints pooled (excluding UVA results) at 0 and 2 h for PET patients (K), scintigraphy patients (L) or the pool of patients (M), whereby the following factors were applied to raw data to get them to the same range (adjusted scale): BBC3 (× 500,000); CDKN1A (× 1,000,000); FDXR (× 1,000,000); GADD45A (× 1,000,000); MDM2: (× 300,000); XPC (× 1,000,000); γH2AX (÷ 100); ROS (÷ 1500). p values (left) are shown if p < 0.05 and effect size d values (right) are shown in green (medium, > 0.5–0.8), blue (large, > 0.8–1.3) or red (very large, ≥ 1.3), Supplemental Table 12. Each symbol represents one patient

