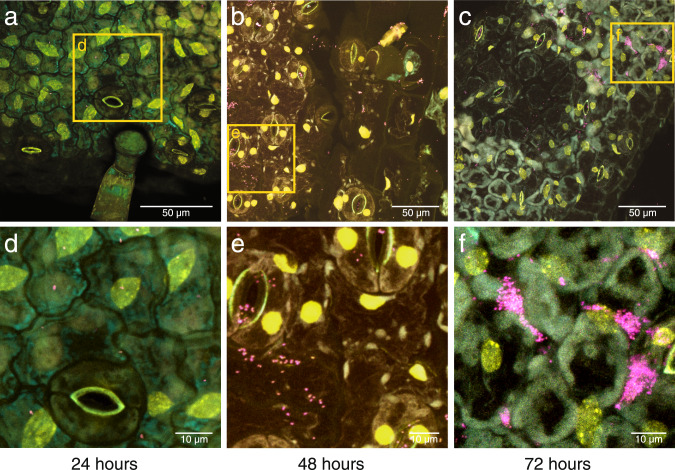
Fig. 2. Microscopic analysis of Msb3 population dynamics after leaf inoculation.
Visualization of bacteria by DOPE-FISH/CLSM microscopy. The FISH probe Burkho was applied to leaves of tomato. The lower epidermis is depicted at different timepoints: a 24, b 48 and c 72 hours post inoculation with a highly diluted bacterial suspension. Plant autofluorescence was visualized through the cyan channel, the Burkho probe through the magenta channel and the nucleic acid stain SYBR-Safe through the yellow channel. Panels a–f all show overlays of all three channels. Panels d, e and f show high-resolution images of the sections highlighted with a yellow frame in a, b and c, respectively.

