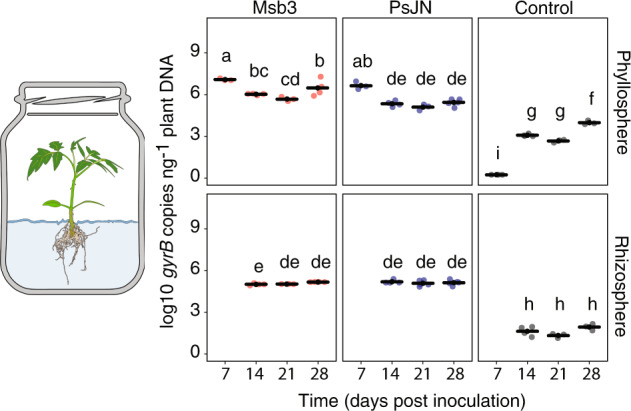
Fig. 3. Quantitative analysis of Msb3 and PsJN population dynamics on different tissues via qPCR.

Tomato plants were grown in vitro in gnotobiotic systems. One third of the plants was inoculated with Msb3 (left panels), one third with PsJN (middle panels) and one third was not inoculated functioning as control (right panels). Each week (x-axes) some plants were harvested, divided into phyllosphere (upper panels) and rhizosphere (lower panels) sections and submitted to DNA extractions. qPCRs were performed on the single copy marker gene gyrB with different, species specific primers for both Msb3 and PsJN. Control samples were subjected to amplification with Msb3 specific primers. Shown are the log10 copy numbers per ng of total DNA (y-axes). Significance was determined between all timepoint and treatments via ANOVA; letters correspond to a Tukey post hoc test.
