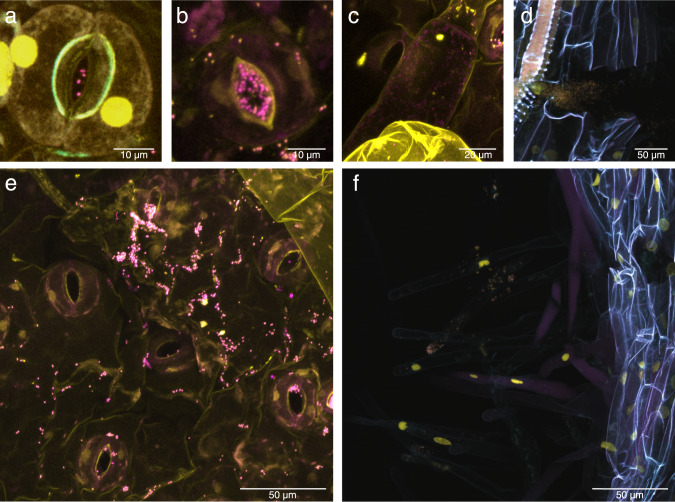
Fig. 4. Colonization patterns of strain Msb3 on tomato.
Visualization of bacteria by DOPE-FISH/CLSM microscopy. Plant autofluorescence was visualized in cyan, signals representing the Burkho probe in magenta and that of the nucleic acid stain SYBR-Safe in yellow. a, d and f are composite images of all three channels, b, c and e are overlays of the magenta and the yellow channel only, as the yellow channel was usually sufficient to visualize epidermal autofluorescence in leaf samples. a, b, c and e are images of the lower leaf epidermis, d and f of roots. a and b show stomata colonized by Msb3, c a trichome. d shows a root crack filled with labelled bacteria, f shows a non-colonized 1st degree side root with root hairs that are colonized at the tips.

