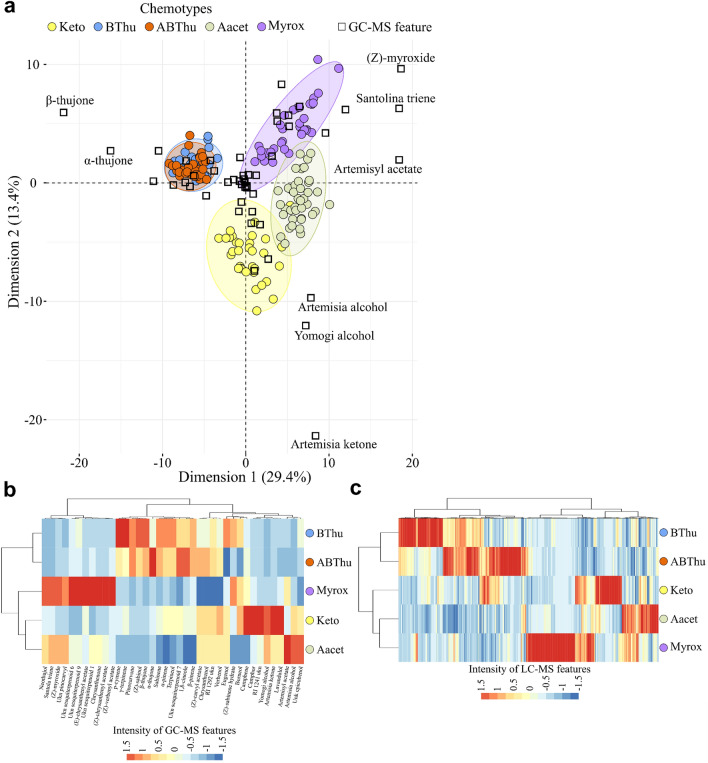
Figure 2.
Identification of tansy chemotypes via GC–MS and LC–MS analyses. (a) Principal component analysis biplot illustrating the discrimination of tansy chemotypes using GC–MS data (52 features). (b) Representation of the levels of the 39 significant GC–MS features (Tukey’s test, P < 0.05, FDR correction) differentiating chemotypes via clustering analysis (Pearson correlation, Ward algorithm). (c) Clustering analysis (Pearson correlation, Ward algorithm) of tansy chemotypes using 809 significant LCMS features (Tukey’s test, P < 0.05 after FDR correction). Keto: artemisia ketone chemotype, Bthu: β-thujone chemotype, ABThu: α-/β- thujone chemotype, Aacet: artemisyl acetate/artemisia ketone/artemisia alcohol chemotype, Myrox: (Z)-myroxide/santolina triene/artemisyl acetate chemotype.

