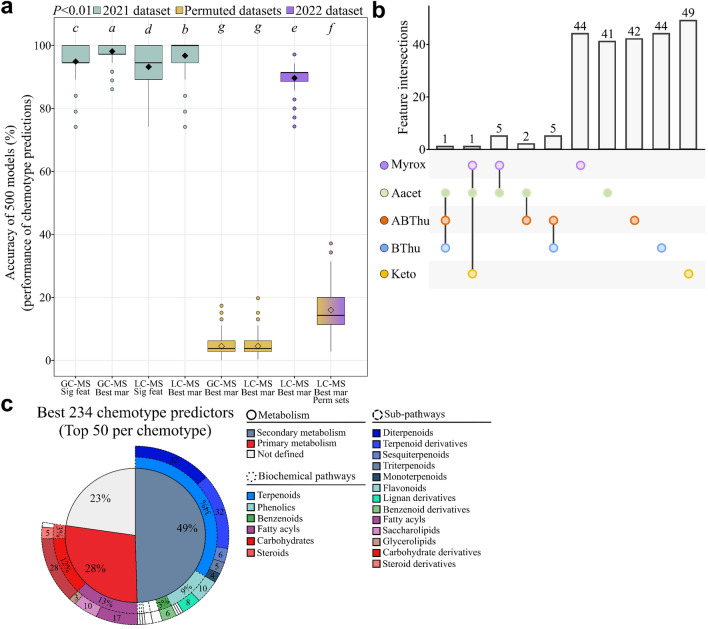
Figure 3.
Predictive metabolomics on tansy plants. (a) R2 scores of the 500 generalised linear models using GC–MS or LC–MS features (Tukey’s test, P < 0.01). For each condition, 500 permuted datasets were created by randomly swapping chemotype classes. Feat: features, Mar: markers, Perm: permuted, Sig: significant. “GC–MS Sig feat” included 39 significant features, “GC–MS Best mar” contained 7 markers, “LC–MS Sig feat” contained 809 significant features, “LC–MS Best mar” included 39 markers. (b) Upset plot of the top 50 markers for each chemotype from LC–MS modelling. The absence of a dot means that the corresponding markers were not present among the best 50 markers in the corresponding chemotypes. (c) Putative annotation of the best LC–MS predictors. Keto: artemisia ketone chemotype, BThu: β-thujone chemotype, ABThu: α-/β-thujone chemotype, Aacet: artemisyl acetate/artemisia ketone/artemisia alcohol chemotype, Myrox: (Z)-myroxide/santolina triene/artemisyl acetate chemotype.

