Figure 4.
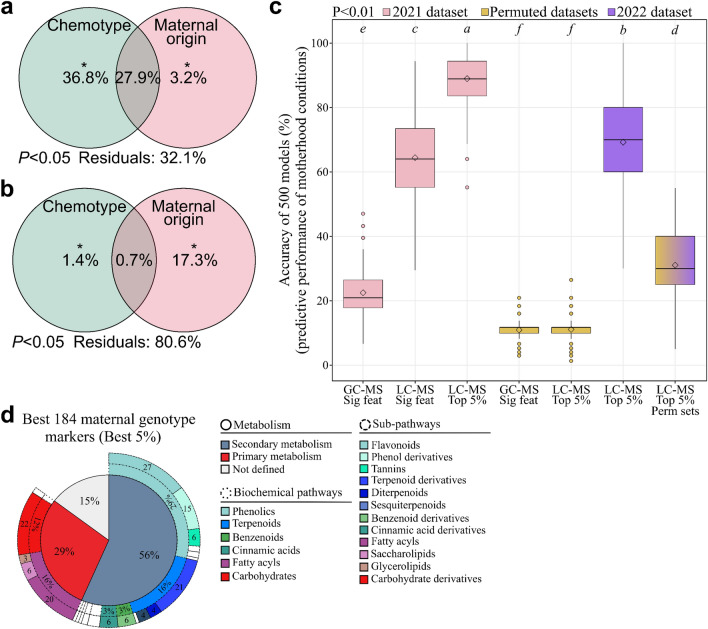
Effect of maternal genotype on intraspecific chemodiversity. (a) Variation partitioning on 52 GC–MS features (ANOVA test, P < 0.05). (b) Variation partitioning on 5,066 LC–MS features (ANOVA test, P < 0.05). (c) R2 scores of the 500 generalised linear models using GC–MS or LC–MS features (Tukey’s test, P < 0.01). For each condition, 500 permuted datasets were developed. Feat: features, Perm: permuted. Sig: significant. “GC–MS Sig feat” included 41 significant features, “LC–MS Sig feat” contained 3,688 significant features and “LC–MS Top 5%” included the best 5% markers (184). (d) Putative annotation of the best LC–MS markers.

