
Figure 3.
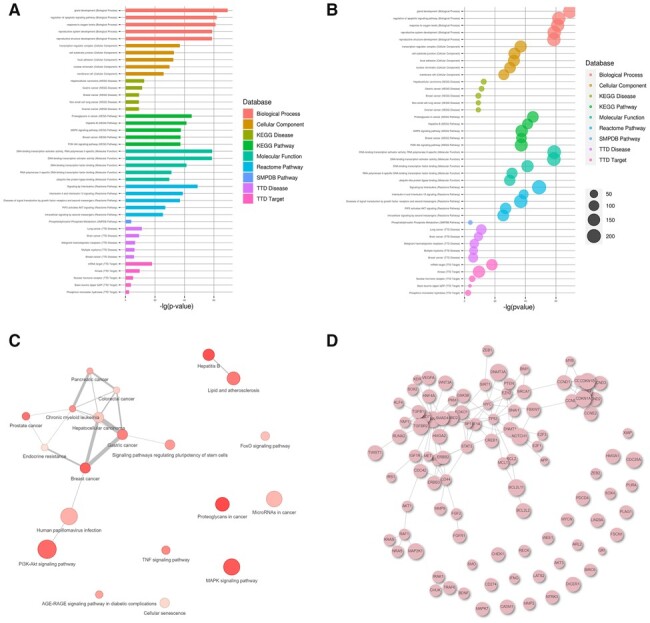
Visualization of the enrichment results by RNAenrich. Bar (A) and bubble (B) plots of enrichment results in five databases. (C) The correlation plot of enrichment results in a single database. (D) The PPI network of proteins that ncRNAs regulate is shown