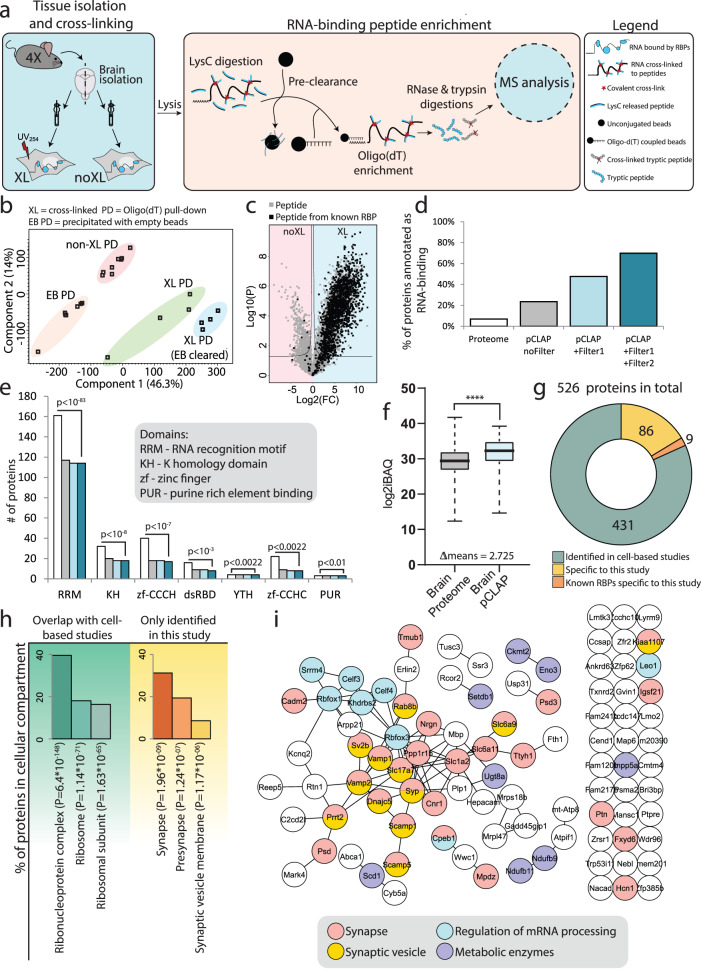
Fig. 1. Experimental setup for brain-pCLAP.
a Experimental workflow of brain-pCLAP: Brain halves from four mice (4X) were homogenized and the right half was cross-linked using UV-light (254 nm). Cells were spun down, and lysates were LysC treated, pre-cleared with empty beads and RNA-peptide complexes were purified using oligo(dT) beads. After elution and trypsin treatment, peptides were analysed using LC-MS/MS. The same experiment was conducted in parallel without the pre-clearance step. b PCA plot of MS data from all samples. c ‘Filter1’: Volcano plot comparing peptide intensities between cross-linked (XL) and non-cross-linked (noXL) samples (two-tailed t test with multiple-testing correction). Each detected peptide is represented by a dot and dots highlighted in black represent peptides from proteins with canonical RBDs. The lines represent thresholds for significant enrichment in the cross-linked (XL) and non-cross-linked samples (noXL). d Percentage of proteins previously annotated as RNA-binding in the proteome and proteins inferred from peptides identified by pCLAP before and after the two data filtering steps. e Number of proteins with shown canonical RBDs in the proteome and in brain-pCLAP with and without the data filtering steps. The p value indicates the enrichment of the fraction of proteins containing each domain in the final brain-pCLAP dataset over the fraction of these protein in the brain proteome46 (one-tailed Fischer’s exact test with FDR correction) (colours as in (d)). f Abundance distribution of total brain proteome and brain-pCLAP. The middle of the box signifies the mean, the box boundaries represent the 25th and 75th percentile and the whiskers reach to the minimum and maximum value of the dataset. n = 4 biologically independent animals. p value calculated using two-tailed t test, ****p < 0.0001. Source data are provided as a Source data file. g Donut plot showing the number of proteins identified by brain-pCLAP, which have also been identified as RBPs from cell line based studies and the number of known RBPs among the proteins specific to this study. h GO term enrichment for cellular compartment for proteins identified as RBPs specifically by brain-pCLAP or those overlapping with cell line based studies. i String network of the 95 proteins identified in this study as RNA binding not identified in previous cell culture-based studies.

