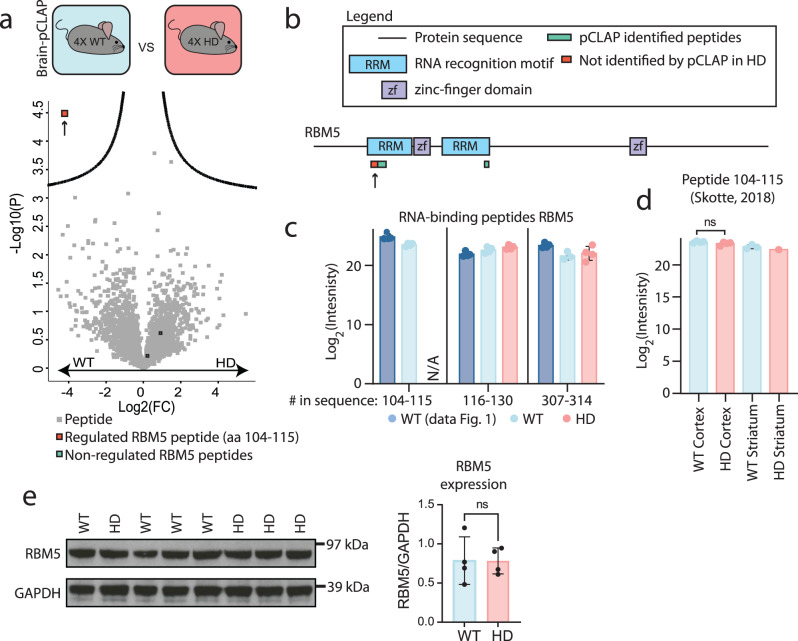
Fig. 3. Comparison of active RBPs in a HD and WT mouse brain samples.
a Volcano plot comparing peptides identified by brain-pCLAP in WT or HD mouse brain samples (two-tailed t-test with multiple-testing correction). b Linear representation of RBM5, its domains and brain-pCLAP identified peptides, with the regulated peptide highlighted by an arrow. c Average Log2 intensities of RBM5 peptides from all brain-pCLAP experiments in this study. d Average Log2 expression intensity of RBM5 peptide spanning amino acids 104–115 in the brain proteome53. e Western blot of RBM5 and loading control GAPDH from WT and HD mouse brain tissues (left) and quantification of the RBM5 signal normalized to the GAPDH signal (right). For all dot plots, n = 4 biologically independent animals. A two-sided t test was used, data are presented as mean values +/− SD. Source data are provided as a Source data file.

