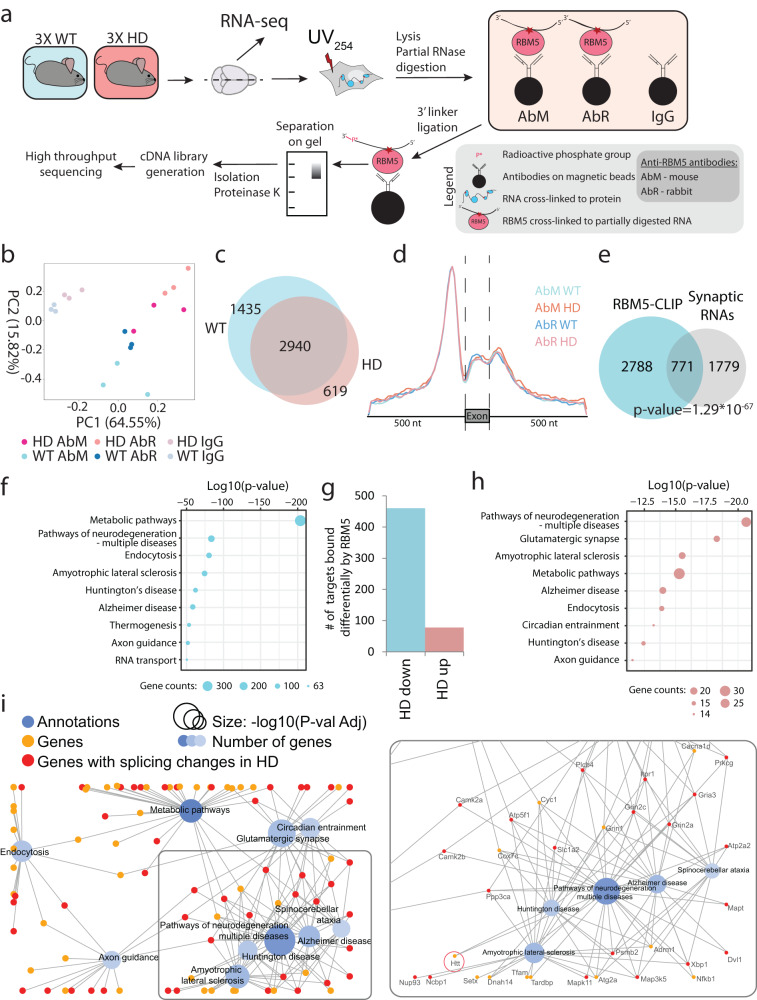
Fig. 4. RBM5-CLIP analysis from WT and HD mouse brain tissues.
a Experimental setup for CLIP analysis from WT and HD brain tissues. Briefly, HD and WT mouse brain tissues were treated with UV-light as for pCLAP. After lysis and partial RNase treatment, RBM5-RNA complexes were isolated using magnetic beads conjugated with either mouse (AbM) or rabbit (AbR) anti-RBM5 antibody and visualised on polyacrilamyde gel. Beads conjugated with unspecific IgG were used as background control. RNA targets bound to RBM5 were then purified and processed by high-throughput sequencing for identification and subsequent analyses. n = 3 independent animals for each sample type. RNA-Seq was subsequently performed from the same samples. b PCA plot showing RBM5-CLIP data with either antibody and the IgG controls. c Number and overlap of RBM5 RNA-targets identified from WT and HD mouse brain tissue (showing targets identified with both antibodies). d Metagene distribution of normalized reads from the RBM5-CLIP samples over exons and flanking intronic regions for all sample groups. e Overlap of RBM5 RNA targets identified by CLIP and RNAs localizing to the synapse70 (p value calculated by one-tailed Fischer exact test). f GO term enrichment analysis for KEGG pathways on RBM5 RNA targets identified by CLIP. g Number of genes encoding transcripts that are bound differentially by RBM5 in HD. h GO term enrichment analysis for KEGG pathways for the transcripts bound differentially by RBM5 in HD (p values in f, h were calculated using one-sided Fischer’s exact test). i Network of the 10 most significantly enriched GO KEGG pathways among genes encoding transcripts bound differentially by RBM5 in HD, where the GO terms are presented as blue nodes and genes falling under these terms are shown as yellow and red nodes connected with an edge to the nodes. Neurodegeneration relevant terms enlarged on the right.

