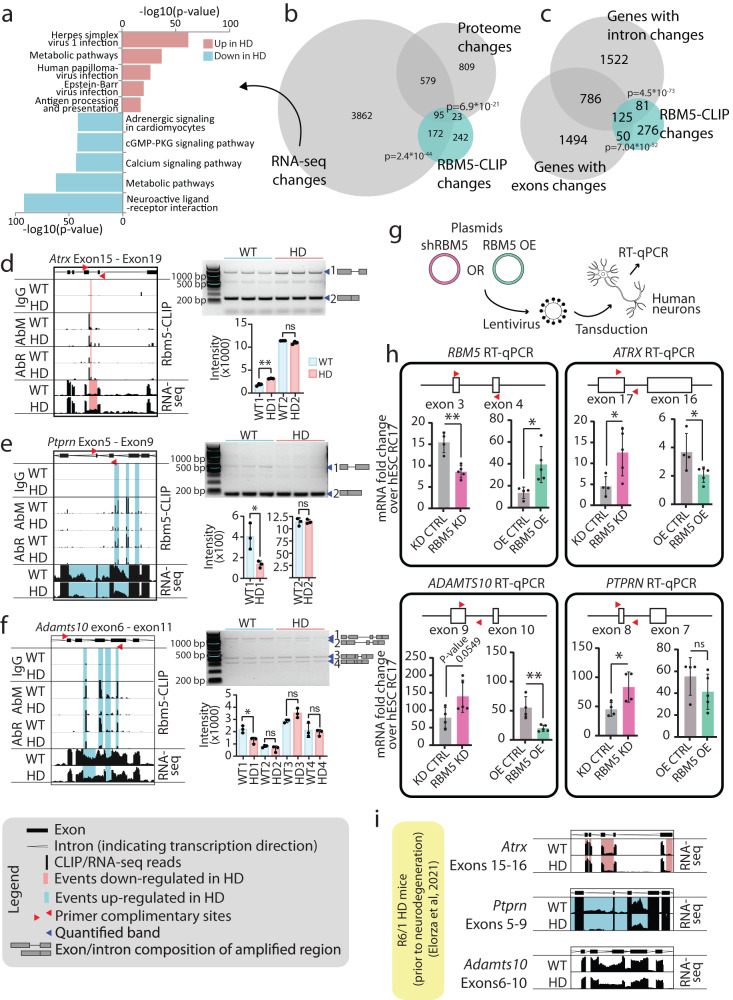
Fig. 5. Changes in transcriptome and proteome in HD coincide with changes in RBM5 RNA-binding.
a GO terms enrichment analysis for KEGG pathways for transcripts regulated in HD (p value: Fischer’s exact test with FDR correction). b Overlap of significant changes in HD mouse brains — RBM5-binding changes detected by CLIP analysis, transcriptome expression changes and proteome expression changes53 (p values: one-tailed Fischer’s exact test corrected for multiple testing). c Overlap of transcripts bound differently by RBM5 in HD and transcripts with intron or exon inclusion changes in HD (p values: one-tailed Fischer’s exact test corrected for multiple testing). d–f Data demonstrating RBM5 binding changes and splicing changes for Atrx, Ptprn and Adamts10. Left: Transcript regions with significant changes in RBM5-CLIP data and RNA-seq data, with the gene model shown on top. Top six lanes show RBM5-CLIP data: top two lanes show IgG controls, followed by RBM5-CLIP data acquired with either antibody (AbM and AbR) for both genotypes. Bottom two lanes show RNA-seq data for both genotypes. Significantly regulated RBM5-binding events or intron/exon inclusion in HD are highlighted. Top right: Gels showing PCR amplification products (location of primers used for PCR indicated with red arrowheads on gene model shown on the left) and the region of the corresponding isoform amplified (indicated on the right of the gel). Bottom right: Average intensity of quantified gel bands. n = 3 independent animals for HD and WT samples. g Schematic representation of RBM5 KD and OE using lentivirus transduction with RBM5 KD or OE vectors. h Normalized intensities for qPCR on human neurons amplifying an exonic region for RBM5 and intronic region for ATRX, ADAMTS10 and PTRPN in RBM5 KD and OE neurons. Primer locations are indicated with red arrowheads. n = 5 biologically independently differentiated and transduced replicates. i Analysis of previously published RNA-seq data from slower progressing HD R6/1 mouse model44 (prior to neuronal loss) for the same regions presented for Atrx, Adamts10 and Ptprn in d–f above. For all dot plots, data are presented as mean values +/− SD, p values: two-tailed t test, *p < 0.05, **p < 0.01, ns = not significant (source data in Source data file).

