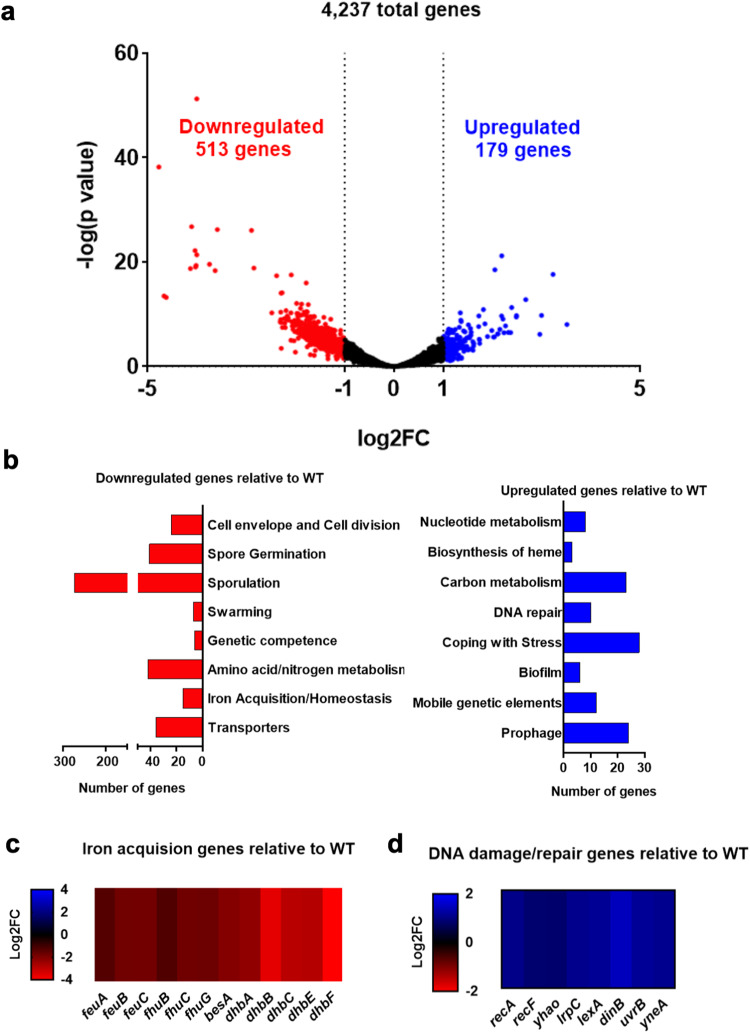
Fig. 3. Global transcriptome analyses reveal differentially expressed genes in the pulcherrimin mutant relative to wild type.
a Volcano plot depicting differentially expressed genes (blue and red dots) based on RNA-Seq and global transcriptome analyses. Downregulated genes with a log2FC of -1 or lower are depicted in red, and upregulated genes with a log2FC of 1 or higher are depicted in blue. Black dots represent genes not differentially expressed. b Significantly upregulated and downregulated genes were categorized according to known or predicted function. The graph shows the number of genes that fall into each category. Blue bars correspond to upregulated genes and red bars, downregulated genes. c, d Heatmaps displaying significantly downregulated genes for iron acquisition/homeostasis (c) and upregulated genes related to the DNA damage response (d) in the pulcherrimin mutant relative to wild type. RNA-seq transcriptome analysis was performed in samples from pellicle biofilms (collected at 72 h). Values are the average of three biological replicates per strain.

