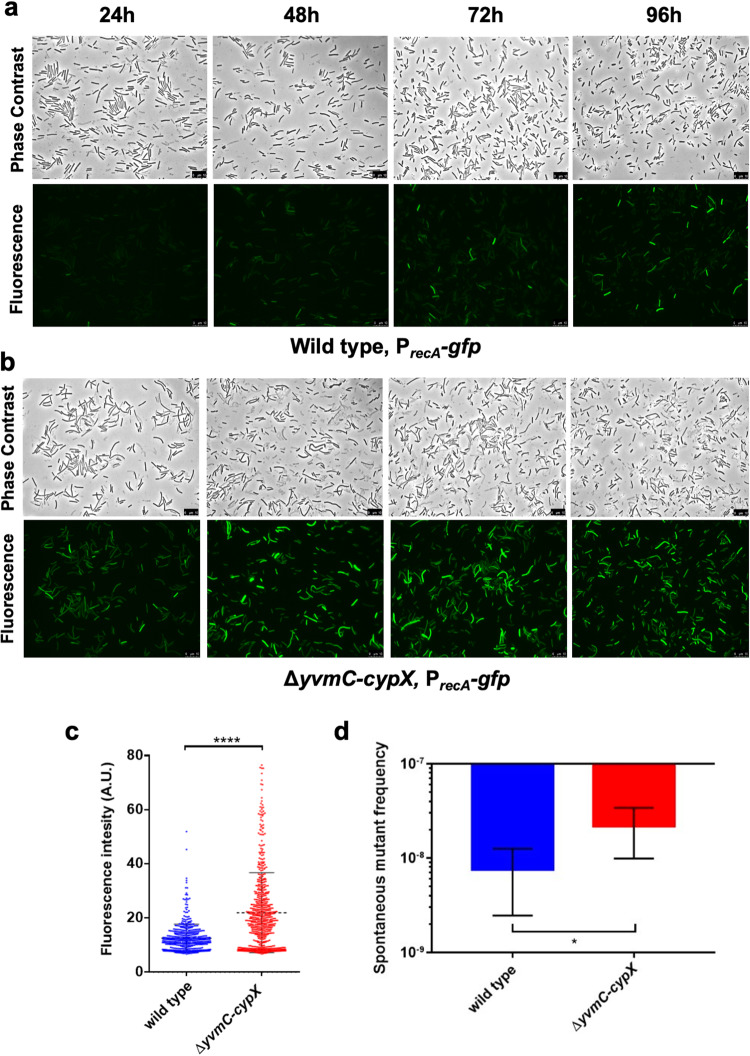
Fig. 4. The DNA damage response is elevated in the pulcherrimin mutant.
a, b Phase contrast and fluorescence microscopy images of the wild type (LA174, top panels, a) and pulcherrimin mutant (LA224, bottom panels, b) bearing the PrecA-gfp reporter for DNA damage response were taken every 24 h during pellicle biofilm development. Scale bar, 10 μm. c Violin plots portraying the distribution of wild-type and pulcherrimin-mutant cells according to their quantified fluorescence collected at 48 h of pellicle biofilm development in (a, b). Each dot represents a single cell. Fluorescence pixel quantification of cells was carried out by using the MicrobeJ plugin of Image J. Median values are represented by dashed horizontal lines. Solid lines represent standard deviation. There is a significant difference in the fluorescence levels between the wild type and the pulcherrimin mutant (p < 0.0001, ****). d The pulcherrimin mutant generates more spontaneous rifampicin mutants compared with the wild type (p = 0.02, *). 24 h cultures in LBGM supplemented with 0.2 mM FeCl3 of the wild-type strain and the pulcherrimin mutant were plated separately onto rifampicin agar plates (5 μg/mL) and incubated overnight. Experiments were performed in biological triplicate and error bars represent standard deviation.

