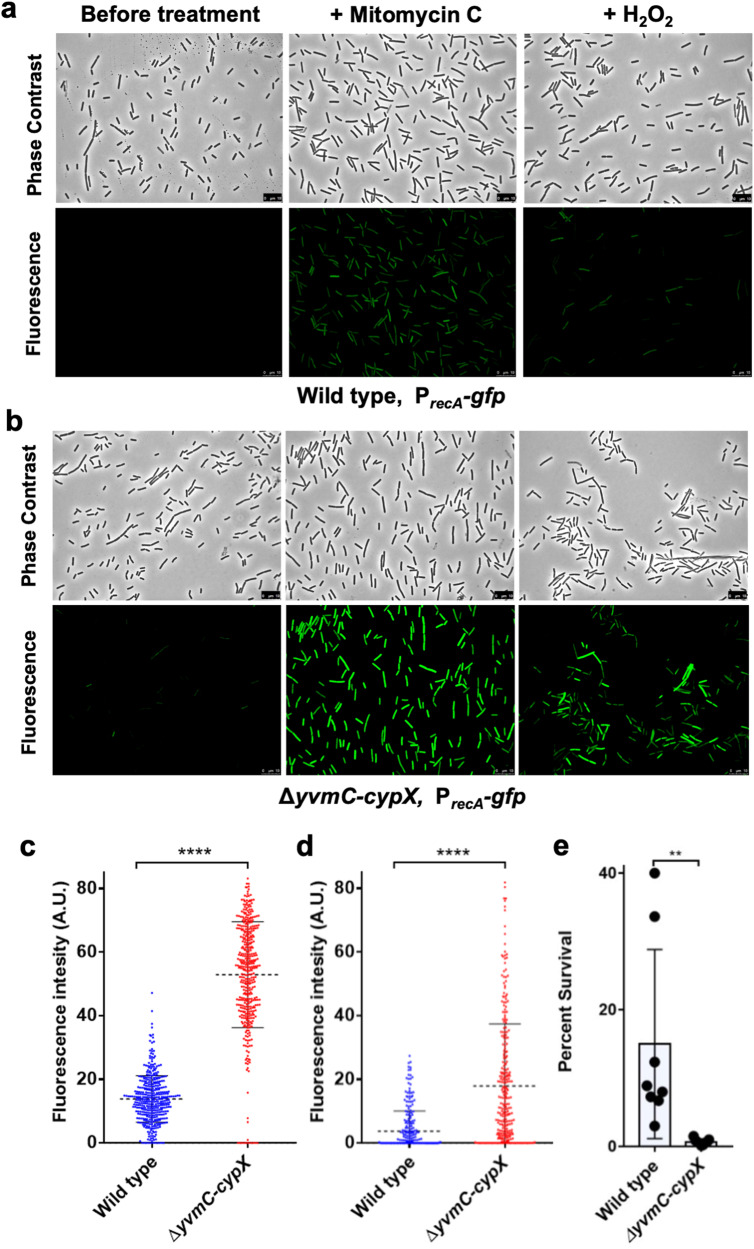
Fig. 5. The pulcherrimin mutant is more sensitive to DNA-damaging agents compared with the wild type.
a, b Phase contrast and fluorescence microscopy images obtained from cultures of the wild type (top panels, a) and the pulcherrimin mutant (bottom panels, b) bearing the PrecA-gfp reporter before and after challenge with the DNA-damaging agents mitomycin C (0.25 μg/mL) or H2O2 (100 μm) for one hour. Scale bar, 10 μm. c, d Single-cell fluorescence was quantified for images in A (treated with mitomycin C, panel C) and in B (treated with H2O2, d) and a violin plot was generated. Each dot in the graph represents a single cell. Median values are represented by dashed horizontal lines. Solid lines represent standard deviation. The pulcherrimin mutant (red) displayed significantly higher fluorescence than the wild type (blue) in both treatments (p < 0.0001, ****). e Percent survival of wild-type cells after treatment with H2O2 (final concentration at 10 mM) for 10 minutes under shaking conditions is significantly higher when compared with the pulcherrimin mutant under the same treatment (p = 0.0039, **). Average is representative of three independent experiments with a total of 8 biological replicates. Each dot represents an individual value for each replicate. Error bars represent standard deviation.

