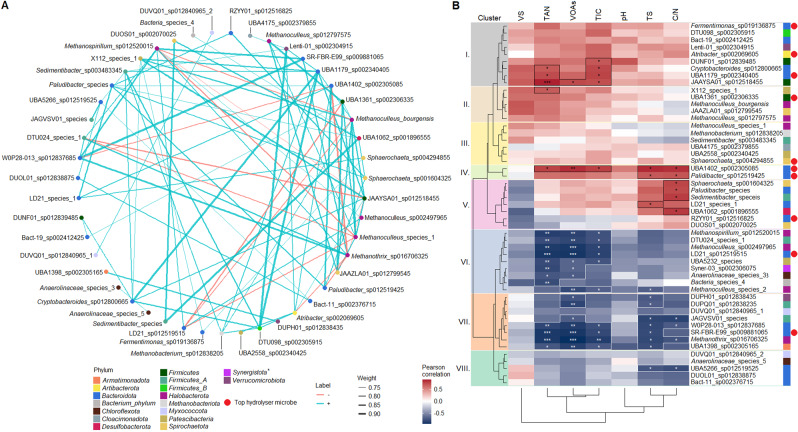
Fig. 6. Correlation analysis of core nrMAGs.
A Pearson correlations between core nrMAGs. The robustness is calculated under the adjusted significant p value is ≤0.05 and the correlation index (Pearson’s rho) is > 0.7 based on network. The blue lines represent positive correlations (Pearson’s rho > 0.7), red lines represent negative correlations (Pearson’s rho < −0.7). A phylum marked with an asterisk is not present among the correlating microorganisms. B Pearson correlations between core nrMAGs and measured AD chemical parameters. Asterisks represent the significant correlations (considered statistically significant as follows: p < 0.05 (*), p < 0.001 (**), p < 0.0001 (***), ns (no significant difference)). Using the cladogram shown on the left and data for TAN (total ammonia nitrogen), VOAs (volatile organic acids), TIC (total inorganic carbon), TS (total solids) and C/N (carbon to nitrogen ratio), eight clusters were distinguished. These are shown here separated by colour as follows: Cluster I: grey; Cluster II: brown; Cluster III: yellow; Cluster IV: green; Cluster V: purple; Cluster VI: blue; Cluster VII: orange; and Cluster VIII: dark green. Coloured boxes represent the specific phyla to which the nrMAGs belong to. Red dots represent the top hydrolysing nrMAGs (n = 10).

