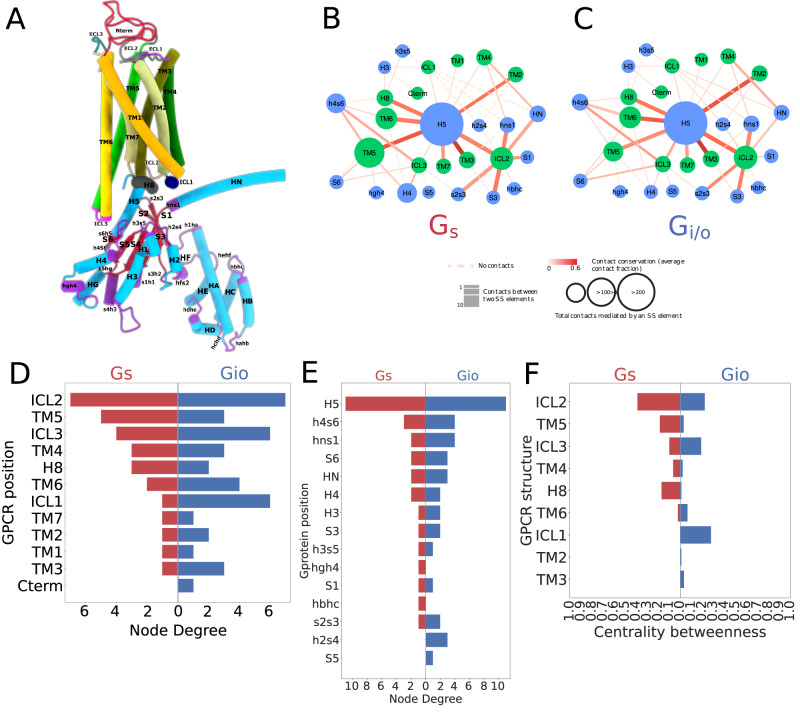
Fig. 2. Interface contact network analysis.
A A representative 3D complex structure (PDB 6CMO) with GPCR and G-protein SSE labels; B SSE contact network for Gs complexes: GPCR and G-protein nodes are colored in green and cyan, respectively. Node diameter is proportional to the total number of contacts mediated by that SSE. Edge thickness is proportional to the number of contacts between connected SSEs and coloring (darker red) is directly proportional to contact conservation; C SSE contact network for Gi/o complexes. Network characteristics as in 2 A; D GPCR SSE network node degree distribution for Gs and Gi/o networks; E G-protein SSE network node degree distribution for Gs and Gi/o networks; F GPCR SSE network betweenness centrality distribution. Source data are provided as a Source Data file.

