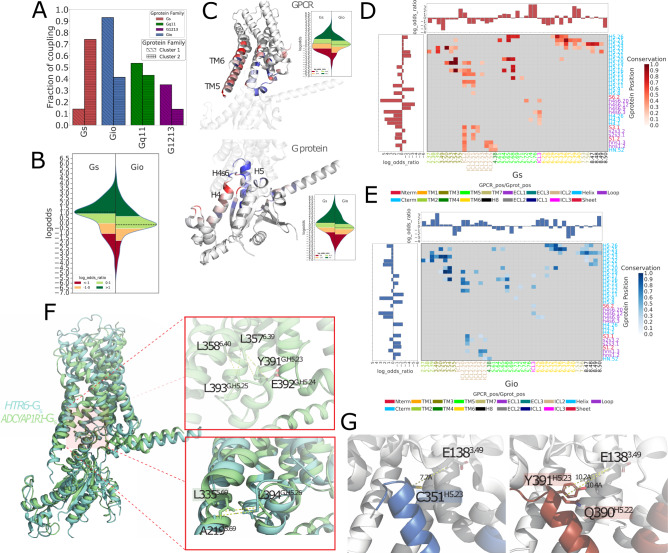
Fig. 4. Analysis of the GPCR-G protein contact fingerprints.
A fractions of experimental coupling groups of the receptors clustered identified through CF clustering; B violin plot showing the distribution of the LOR statistics for GPCR-G-protein contacts. Dashed lines indicate the median value; C Gi/o log-odds ratio statistics represented with a color scale ranging from blue (negative LOR) to red (positive LOR) using B-factor annotations on a representative structure (PDB ID: 7VL9): receptor (top, chain R), G-protein (bottom, chain A) along with distribution of the LOR statistics for GPCR (top) and G-protein (bottom) contact positions. Dashed lines in the violin plots indicate the median value; D Gs complexes contact frequency heatmaps: columns are GPCR positions in GPCRdb numbers, and rows are G-protein positions in CGN numbers. Only contacts with frequency > 20% (over the number of unique complexes) are considered; E Gi/o complexes contact frequency heatmaps: representation features are as in 4D; F structural comparison of Gs complexes mediated by a class A (HTR6; cyan; PDB: 7XTB) and class B representative (ADCYAP1R1; light green; PDB 6P9Y) and zoomed view of the contacts mediated by GPCR positions 6.39, 6.40 and 5.69, respectively with G-protein positions H5.23, H5.24, H5.25, H5.26; G zoomed view of the contacts mediated by GPCR position 3.49 in a representative Gi/o complex (CCKAR; PDB 7EZH) and distances between closest G-protein amino acids to E138 3.49 in the Gs complex of the same receptor (PDB: 7MBX). Source data are provided as a Source Data file.

