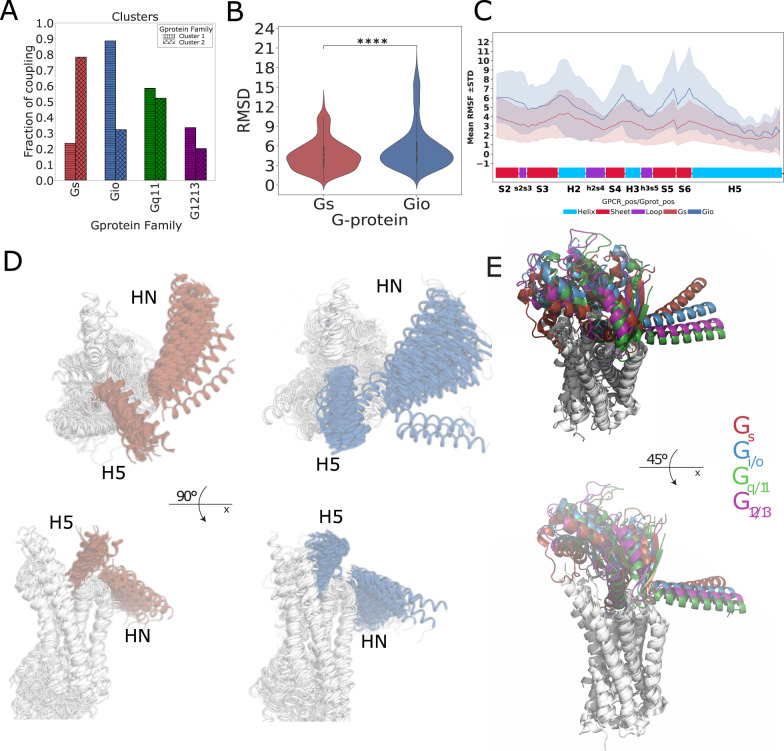
Fig. 7. Measuring similarity of G-protein docking modes.
A Barplot of the coupling preferences of receptors of Cluster 1 and 2; B distribution of the RMSD within Gs and Gi/o complexes, n = 2628 experimental structure pairs for Gi/o and n = 903 experimental structure pairs for Gs, p-value has been computed with the Wicoxon rank-sum, two-sided test with Bonferroni correction P = 2.512E-14 (**** P < 0.0001). Boxplots show the median as the centre and first and third quartiles as bounds of the box; the whiskers extend to the last data point within 1.5 times the interquartile range (IQR) from the box’s boundaries; C root mean squared fluctuations of the G-protein consensus positions, each point is represented as mean ± SD calculated from n = 125 experimental structures. P has been computed via a Wilcoxon rank-sum test with Bonferroni correction (P = 1.18E-13); D superposition of class Gs and Gi/o representative complexes: GPCR 7TM bundles are represented as white cartoons; the N-term and C-term of the Gs (red, left) and Gi (blue, right) alpha subunits are represented as marker of the G-protein structural variability on experimental complexes; E structural superimposition of representative structures defined on the basis on minimum RMSD to other members of the group (for Gs and Gi/o) and release date (Gq/11): Gs (PDB: 7XTB; red), Gi/o (PDB: 7VL9; blue), Gq/11 (PDB: 7EZM; green), G12/13 (PDB: 7T6B;purple). Source data are provided as a Source Data file.

