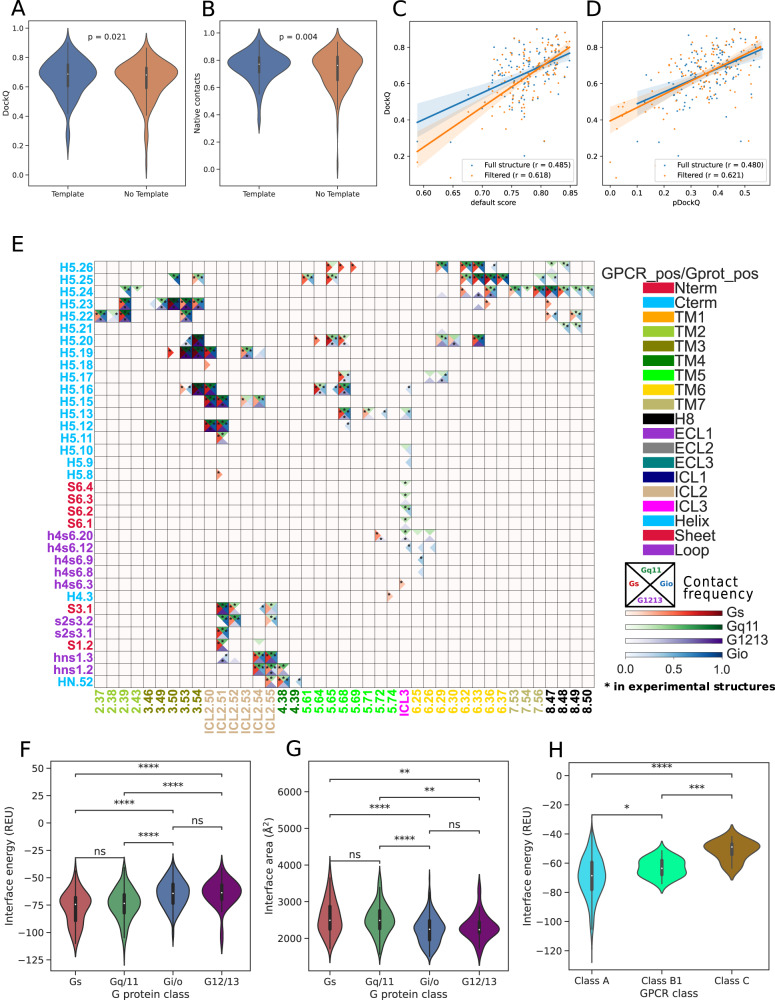
Fig. 9. AlphaFold-multimer prediction of experimental GPCR-G protein complexes.
Evaluation of AlphaFold models with a resolved experimental structure. A DockQ and B fraction of retrieved native contacts for the models generated with and without the usage of available 3D experimental templates of the monomer structures. N = 125 structural complex models computed for both conditions. The p-values have been computed with a two-sided Wilcoxon signed-rank test. Scatterplot of the DockQ of AlphaFold models computed using structural templates as a function of C the default score and D the pDockQ. Translucent bars represent 95% confidence intervals estimated with bootstrap. Filtered models contain only the residues with pLDDT ≥ 70. Binding energy of the filtered AlphaFold models estimated through Rosetta; E Alphafold complexes contact frequency heatmap for Gs (red scale), Gi/o (blue scale), Gq/11 (green scale) and G12/13 (purple scale), each corresponding to a differently colored triangle: columns are GPCR positions in GPCRdb numbers, rows are G-protein positions in CGN numbers. Only contacts with frequency > 20% (over the number of unique complexes) are considered. The color intensity is proportional to the contact frequency. Experimental contacts are marked with a black asterisk; for E) all GPCR classes and F) only class A receptors. F ∆G binding (REU) predicted for AlphaFold-multimer complexes; p-values: Gs v.s. Gq/11 = 0.67; Gq/11 v.s. Gi/o = 1.55e-15; Gi/o v.s. G12/13 = 1; Gs v.s. Gi/o = 3.28e-11; Gq/11 v.s. G12/13 = 1.30e-5; Gs v.s. G12/13 = 4.06e-6; G Delta Solvent Accessible Surface Area (∆SASA); p-values: Gs v.s. Gq/11 = 1; Gq/11 v.s. Gi/o = 7.34e-16; Gi/o v.s. G12/13 = 1; Gs v.s. Gi/o = 5.52e-8; Gq/11 v.s. G12/13 = 3.45e-3; Gs v.s. G12/13 = 8.06e-3. The analysis considers n = 87 Gs, n = 265 Gq/11, n = 430 Gi/o, and n = 43 G12/13 structural complex models; H ∆G binding (REU) of complexes with class A, class B1, and class C receptors. The p-values have been computed with a two-sided Mann–Whitney U test with Bonferroni correction. ns P > 0.05; * P < 0.05; ** P < 0.01; *** P < 0.001; **** P < 0.0001. Boxplots show the median as the center and the first and third quartiles as the bounds of the box; the whiskers extend to the last data point within 1.5 times the interquartile range (IQR) from the box’s boundaries. Source data are provided as a Source Data file.

