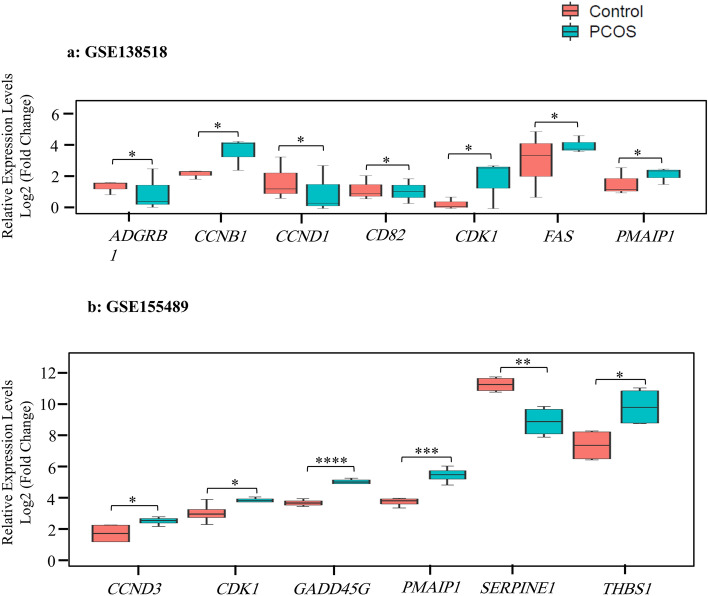
Figure 3.
Expression levels of differentially expressed p53 target genes in 2 datasets. Box and whisker plots represent median and inter-quartile range (P25–P75). mRNA expression of the (a) 7-gene signature based on the GSE138518 dataset, (b) 6-gene signature according to the GSE155489 study. R package (version 4.1.2) limma, using an Empirical Bayes method, Benjamini–Hochberg adjustment for correction and control of the FDR (False Discovery Rate) across significant genes, and t-test, was applied to identify differentially expressed genes. *p < 0.05, **p < 0.01, ***p < 0.001, ****p < 0.0001.

