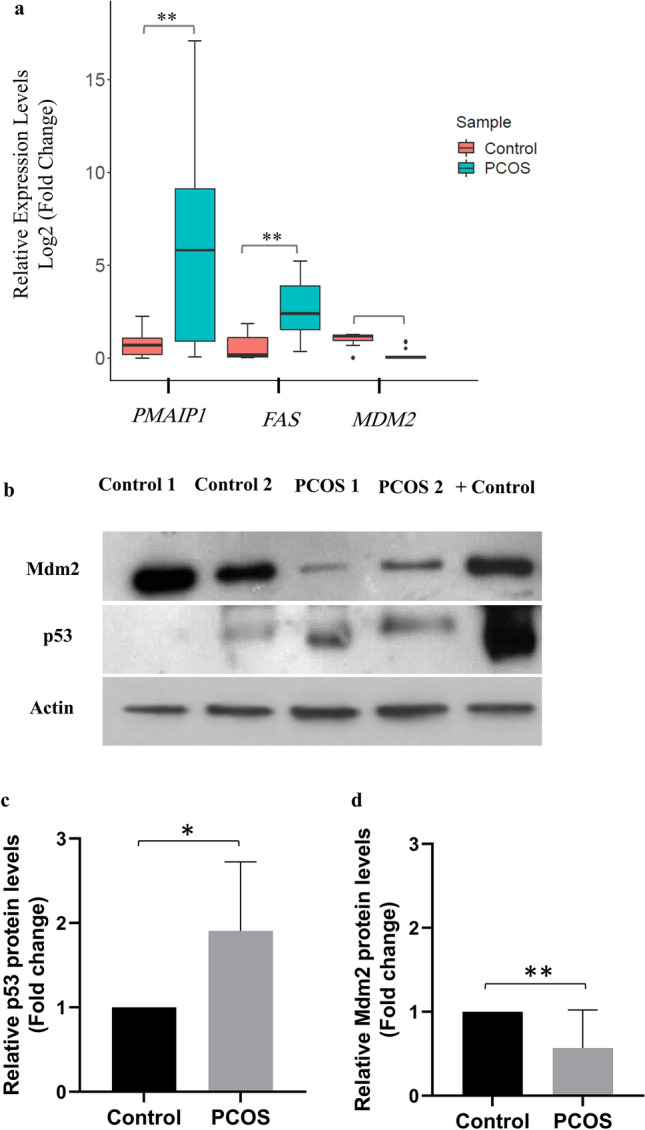
Figure 5.

Validation of several differentially expressed p53 target genes. (a) qRT-PCR analysis of PMAIP1, FAS and MDM2 genes in PCOS individuals (20) compared to the controls (18). The Mann–Whitney test was used and error bars represent SEM. (b) Western blot analysis of p53 and Mdm2 proteins in PCOS women compared to the controls. The Thermo scientific protein ladder, (10 to 180 kDa) was used as size standards for monitoring protein migration, protein transfer to membranes, and sizing proteins. The blots were cut into 3 pieces at ~ 70 kDa, a little under ~ 55 kDa, and a little under ~ 40 kDa for Mdm2 (90 kDa), p53 (53 kDa), and actin (42 kDa), respectively, prior to hybridization with antibodies. The intensity of p53 blots (c) (p < 0.05) and Mdm2 blots (d) (p < 0.01) for 6 PCOS and 6 control samples (western blot of the other 4 PCOS and 4 control samples are presented in Supplementary Fig. 2) was quantified by Image J software and normalized with the actin control. The blots were cropped and the original blots are presented in Supplementary Fig. 3. The samples derive from the same experiment and that blots were processed in parallel. The Student unpaired t-test was performed and error bars represent SEM. + Control, Nalm-6 wild-type TP53 cell line treated with RG7388 (An inhibitor of p53-Mdm2 interaction). *, p < 0.05; **, p < 0.01.
