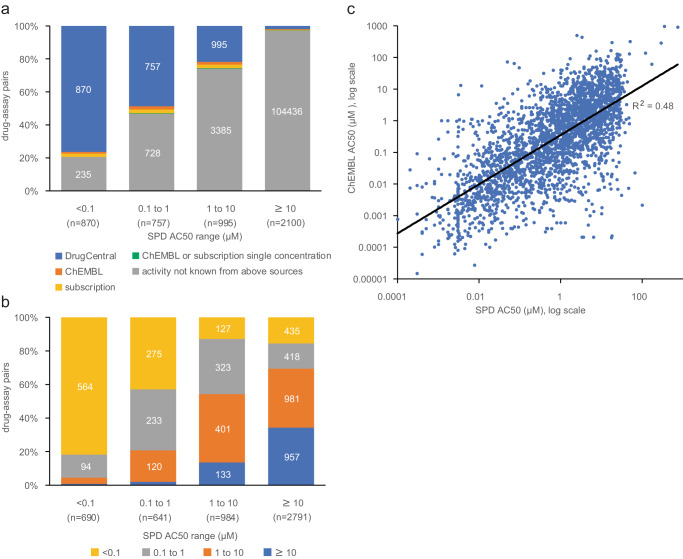
Fig. 1. Safety pharmacology results vs. literature-based resources.
a Distribution of AC50 values from SPD by AC50 range, where highly active results are denoted as AC50 < 0.1 µM and inactive results as AC50 ≥ 10 µM. Drug-assay pairs were cross-referenced to resources containing results curated from the biomedical literature: DrugCentral AC50 < 10 µM or target annotated as the MOA in DrugCentral (blue), ChEMBL AC50 < 10 µM (orange), subscription resources AC50 < 10 µM (yellow), or single concentration activity > 50% in either ChEMBL or subscription resources (green). Resources were labeled hierarchically, i.e., activities reported in DrugCentral are mostly available in ChEMBL and other resources. b qualitative comparison of median ChEMBL vs. SPD AC50 values for 5106 drug-assay pairs; SPD results with AC50 qualifier > (AC50 greater than max concentration tested) are shown as ≥10 µM. c quantitative comparison of median ChEMBL vs. SPD AC50 values for 2700 drug-assay pairs where the SPD AC50 qualifier is = (i.e., measurable activity); Pearson R2 = 0.48.

