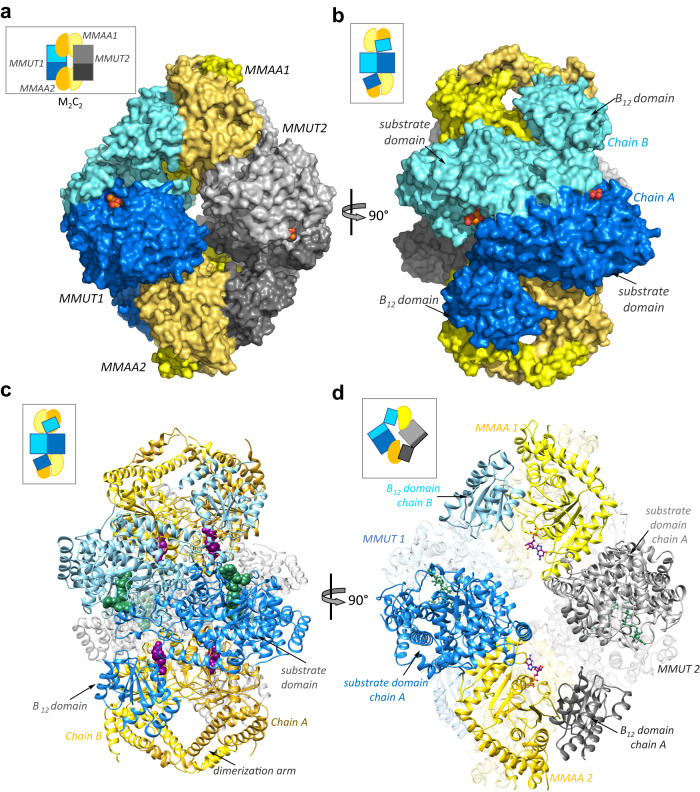
Fig. 2. Structure of the human M2C2 complex.
A Surface representation of the M2C2 structure. MMUT1 and 2 are shown in blue and grey, respectively and the dark and light shades of MMAA (yellow) represent the monomeric chains in each α2 dimer. B A 90° rotation shows that each MMUT chain (dark and light blue) interacts with one MMAA dimer. C, D Ribbon representation of the M2C2 complex. GDP (purple) and CoA (green) are shown as spheres. D One chain in MMAA2 (gold) simultaneously interacts with the substrate-domain in MMUT1 (dark blue) and the B12-domain in MMUT2 (dark grey). GDP (purple) and CoA (green) are shown as sticks.

