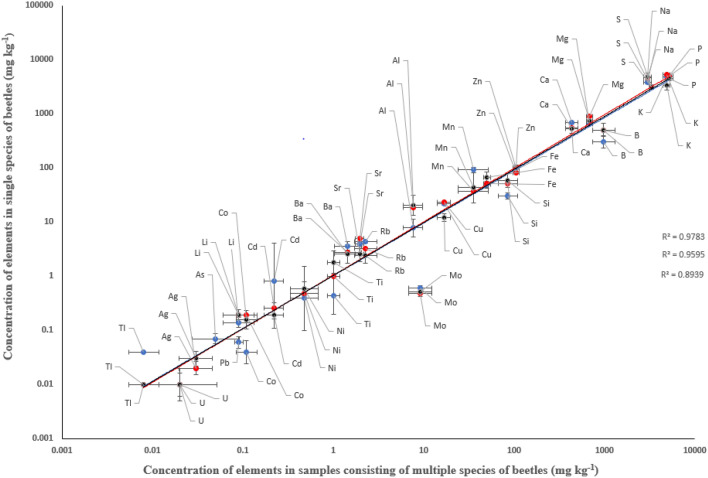
Fig. 3.
Concentrations of elements (mg kg−1) in C. caraboides (blue, n = 2), C. glabratus (red, n = 1) and Pterostichus sp. (black, n = 21) in samples collected in 2007 as a function of the concentration of the elements measured in beetle samples (n = 5) consisting of several species, collected in 2008. Solid lines represent linear regression between the concentrations measured in individual species and the mixed samples. C. caraboides: slope = 1.00, 95% confidence interval 0.95–1.05; R2 = 0.98; C. glabratus: slope = 1.07, 95% confidence interval 0.99–1.15; R2 = 0.96. Pterostichus sp: slope = 0.91, 95% confidence interval 0.79–1.03; R2 = 0.89. The values for Be, Bi, Cr, Se, Th and V are not shown as their concentrations in the animals were below the detection limit

