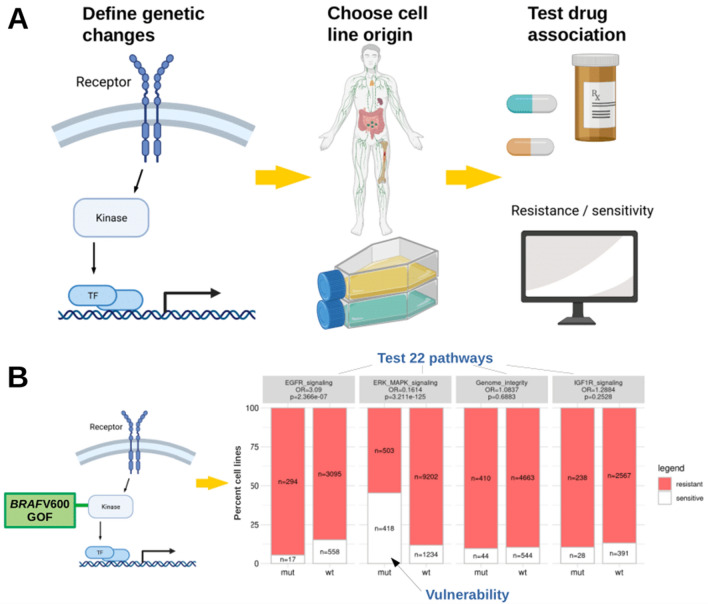
Fig. 1.
Workflow of the webtool and verification of the BRAF–MAPK pathway association. A Users define custom genetic changes and test across cell lines from various cancer entities. Categorization in ‘resistant’ or ‘sensitive’ from Iorio et al. (Iorio et al. 2016): cell viability measured using the CellTiter-Glo® Assay, IC50 values subsequently estimated by a non-linear mixed effects model, binarization threshold for each drug. B Principle of testing the gain of function (GOF) BRAF V600-mutated cell lines revealing moderate resistance to EGFR and strong sensitivity to ERK/MAPK pathway compounds. Odds ratios (OR) for resistance in the altered cell lines (mut) above each bar plot (Fisher’s tests). Numbers of cell lines pooled in each pathway category differ by available data indicated in the bars. Using Bonferroni correction for testing 22 pathways, p-values < 0.0023 are considered significant

