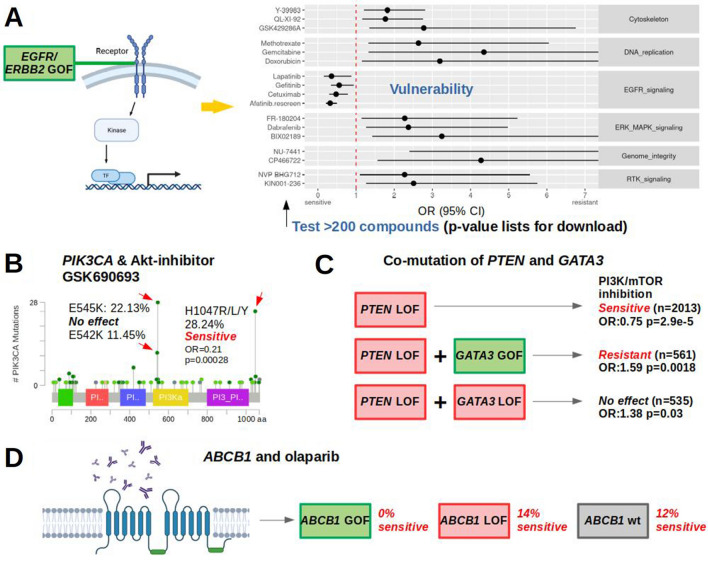
Fig. 3.
Verification of EGFR pathway association and new drug dependencies. A Compounds that show activity in EGFR/ERBB2-activated cell lines almost exclusively belong to the EGFR pathway. Forest plot with OR > 1 shows resistance of altered cell lines to drugs, OR < 1 indicates sensitivity. Compounds shown if p < 0.05 from Fisher’s exact tests for candidate approaches. For discovery testing 250 compounds, Bonferroni-corrected p < 0.0002 are considered significant. B Within frequent PIK3CA point mutations only H1047 mutant cell lines were sensitive to AKT-inhibitor GSK690693 (Supplementary Table 3). Frequencies and image for CCLE 2019 from www.cbioportal.org. Colored regions: protein domains. Light green: missense variants of unknown significance, dark green: driver missense mutations. C GATA3 activation and abolished PTEN-related sensitivity to PI3K/mTOR inhibition. D Model of olaparib exclusion with activated ABCB1. GOF/LOF: gain/loss of function

