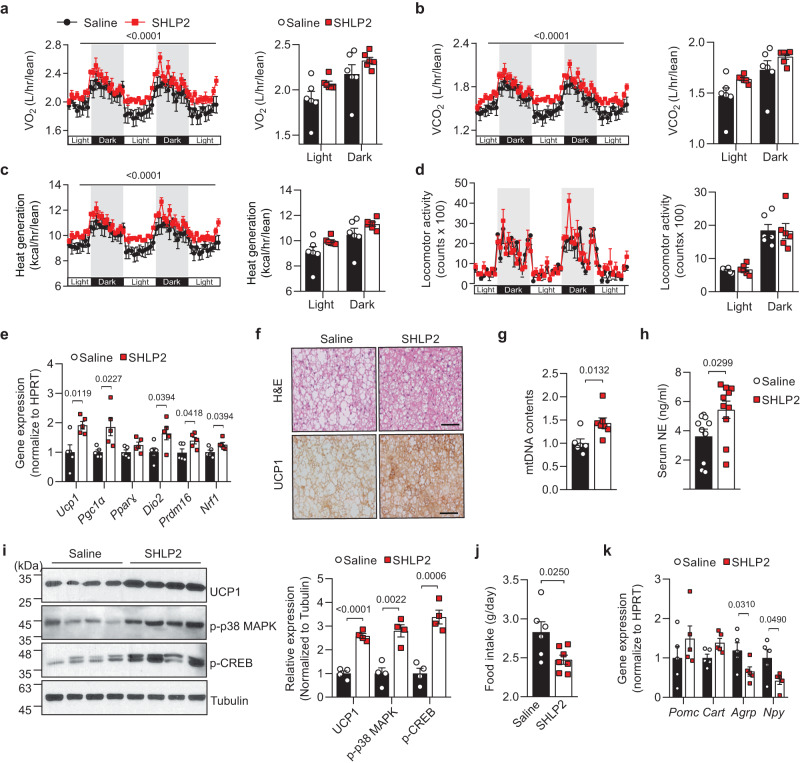
Fig. 2. SHLP2 enhances iBAT thermogenesis and suppresses energy intake.
a–d Temporal changes (left) and average values (right) of O2 consumption (a), CO2 production (b), heat generation (c), and locomotor activity (d) from HFD-fed male mice with IP administration of either saline or SHLP2 (n = 6 each group). e Expression of thermogenic genes in iBAT from indicated groups (n = 5 each group). f Representative H&E (top) and UCP1 (bottom) staining from iBAT of HFD-fed male mice (n = 3 each group). g Mitochondrial DNA contents in the iBAT (n = 6 saline, n = 7 SHLP2). h Serum norepinephrine (NE) levels in indicated group (n = 10 each group). i Immunoblots (left) and relative densitometry (right) of UCP1, p-p38 MAPK, p-CREB expression in the iBAT samples (n = 4 each group). Data shown are representative of three independent experiments with similar results. j Daily food intake of HFD-fed male mice treated with either saline or SHLP2 (n = 6 saline, n = 7 SHLP2). k Gene expression of neuropeptides regulating feeding in the hypothalamic samples (n = 5 each group). Scale bars, 50 µm. n indicates the number of biologically independent animals examined. Data were presented as mean ± SEM. Two-tailed Student’s t tests were used in bar graphs, and two-way ANOVA with Bonferroni post-hoc tests were used in line graphs. Source data are provided as a Source Data file.

