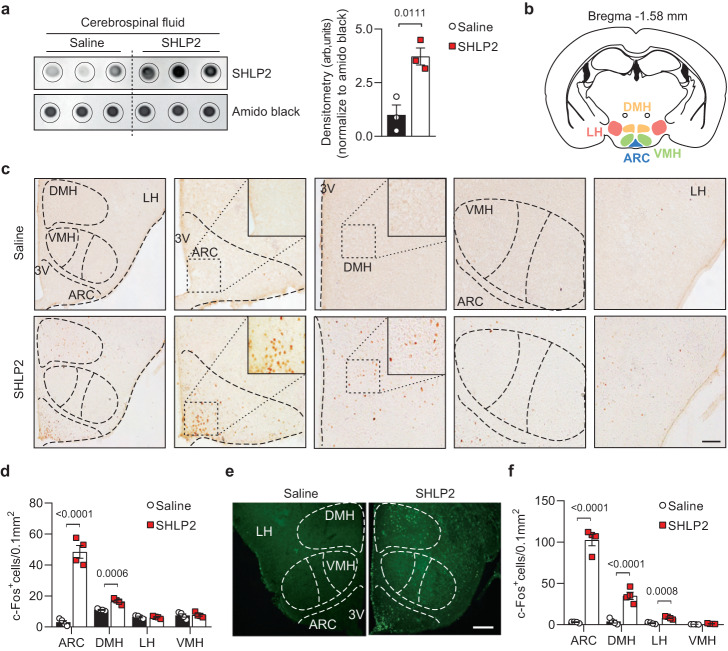
Fig. 3. SHLP2 induces c-Fos activation in hypothalamic neurons.
a Dot blots (left) for SHLP2 and their relative densitometry (right) in CSF after an IP injection of saline or SHLP2 (n = 3 each group). b, c c-Fos immunoactivity in mediobasal hypothalamic nuclei after an IP injection of saline or SHLP2. d Quantification of c-Fos activities from (c) (n = 4 each group). e, f Representative figures (e) and graph quantification (f) of c-Fos immunoreactivity in hypothalamic regions after an ICV administration of saline or SHLP2 (n = 4 each group). Scale bars, 100 µm. n indicates the number of biologically independent animals examined. Data were presented as mean ± SEM. Two-tailed Student’s t tests were used in bar graphs. Source data are provided as a Source Data file.

