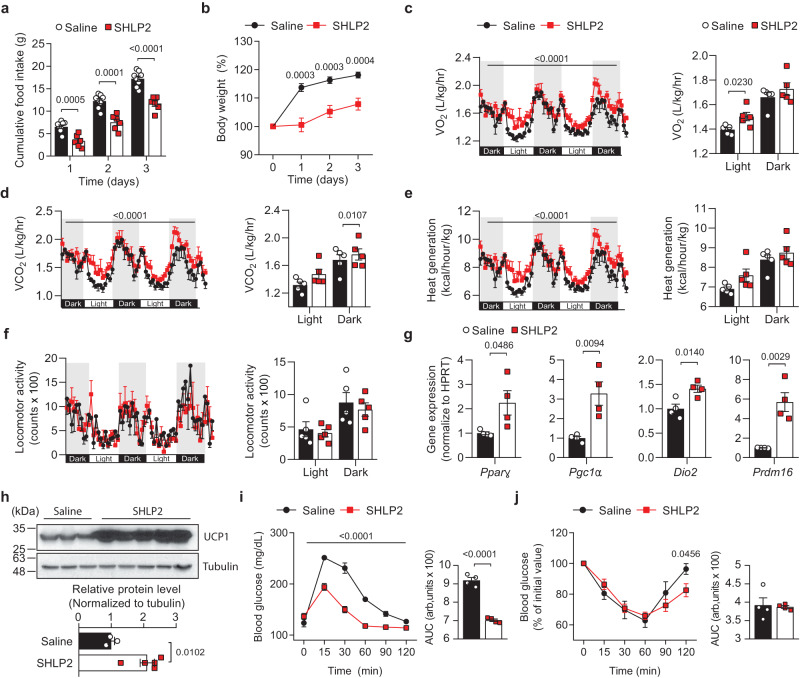
Fig. 4. Central SHLP2 regulates energy homeostasis.
a, b Cumulative food intake (a) and percent body weight change (b) after an ICV administration of saline or SHLP2 (n = 8 saline, n = 6 SHLP2). c–f Temporal changes (left) and average value (right) of O2 consumption (c), CO2 production (d), heat generation (e), and locomotor activity (f) of male mice after an ICV injection of saline or SHLP2 (n = 5 each group). g Expression of thermogenic genes in the iBAT (n = 4 each group). h Immunoblots (top) for UCP1 and relative densitometry (bottom) in the iBAT (n = 3 saline, n = 5 SHLP2). Data shown are representative of three independent experiments with similar results. i, j GTT (i) and ITT (j) were performed in NC-fed male mice after 4 hrs of ICV administration of saline or SHLP2 (n = 4 each group). n indicates the number of biologically independent animals examined. Data were presented as mean ± SEM. Numbers of animals examined were expressed in parenthesis. Two-tailed Student’s t tests were used and two-way ANOVA with Bonferroni post-hoc tests were used in (c–f), (i). Source data are provided as a Source Data file.

