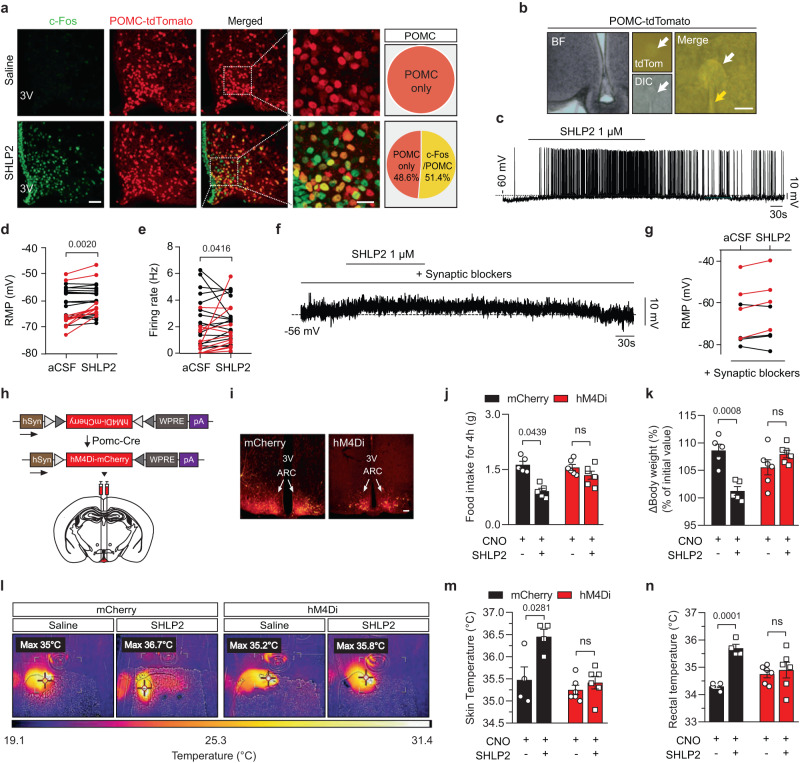
Fig. 5. SHLP2 activates POMC neurons and it requires for metabolic effects of SHLP2.
a Percentage of c-Fos activation in POMC neurons after an ICV administration of SHLP2 (n = 3 each group). Scale bars, 20 µm. b POMC neurons are targeted using fluorescent (tdTomato) or differential interference contrast (DIC) microscopy in the tdTomatoPOMC-Cre male mice. White and yellow arrows indicate the targeted cell and patch pipette. Scale bars, 10 µm. c–e Representative depolarization response (c) of POMC neurons and effects on resting membrane potential (RMP) (d) and firing rate (e) of a subset of POMC neurons (n = 27 neurons from 11 animals, red: cells showing an increase in RMP more than 2 mV). f, g Representative depolarizing response (f) and summary graph (g) of POMC neurons under the pretreatment of synaptic blockers (red: cells showing an increase in RMP more than 2 mV). h Design of AAV virus (top) bilaterally injected into the ARC. i mCherry fluorescence confirming the viral targets of POMC neurons in the ARC of POMC-cre male mice. Scale bars, 100 µm. hSyn, Human synapsin 1 promoter; hM4Di-mcherry, Gi-coupled hM4D DREADD fused with mCherry; WPRE, woodchuck hepatitis posttranscriptional regulatory element; pA, poly(A) tails. j, k Cumulative food intake (j) and ∆Body weight (%) (k) after ICV administration of SHLP2 in the POMC-mCherry or POMC-hM4Di male mice (n = 5 each mCherry group, n = 6 each hM4Di group). l, m Representative thermal images (l) and average skin temperature (m) measured by thermoscanner. n Effect of SHLP2 on rectal temperature (n = 4 each mCherry group, n = 6 each hM4Di group). n indicates the number of biologically independent animals examined. Data were presented as mean ± SEM. Two-tailed Student’s t tests were used in bar graphs. Wilcoxon matched-pairs signed rank test were used in electrophysiological result. Source data are provided as a Source Data file.

