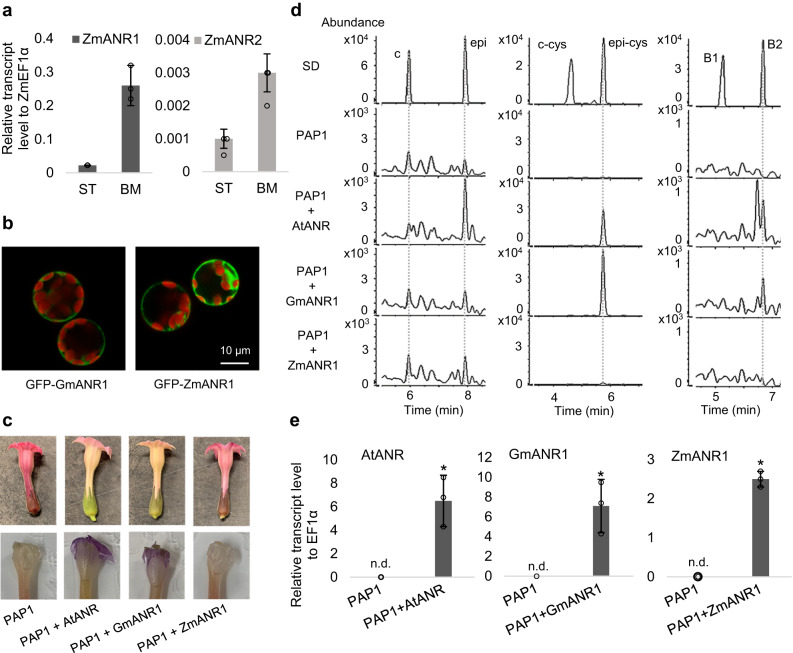
Fig. 1. Ectopic expression of ZmANR1 fails to generate PA precursors in high anthocyanin producing tobacco.
a Transcript levels of ZmANR1 and ZmANR2 in developing seeds (14-days after pollination) of maize cultivars ST (Suntava) and BM (Black Mexican). Data are presented as mean ± S.D. (n = 3, independent biological replicates). Differences in transcript levels of ZmANR1 and ZmANR2 between ST and BM maize are significant (P < 0.01) as determined by two-tailed Student’s t-test. ZmEF1α was used as the reference gene. b Confocal microscopy images of GFP-tagged GmANR1 and ZmANR1 showing their subcellular localization in A. thaliana protoplasts. GFP-tagged GmANR1 and ZmANR1 appear green. Autofluorescence of chloroplasts appears red. Images are representative of three independent replicates. c Images of tobacco flowers expressing PAP1, PAP1 with AtANR, PAP1 with GmANR1, and PAP1 with ZmANR1 before (top) and after (bottom) DMACA staining. The distribution of PAs in tobacco flowers is indicated as purple coloration after DMACA staining. AtANR and GmANR1 were cloned from Arabidopsis thaliana (Col-0) and Glycine max (cv Clark), as described23 (d) Selected ion chromatogram of catechin and epicatechin (left, m/z = 289.0718 ± 10 ppm), 4β-(S-cysteinyl)-catechin and 4β-(S-cysteinyl)-epicatechin (middle, m/z = 408.0759 ± 10 ppm), procyanidin dimers B1 and B2 (right, m/z = 577.1360 ± 10 ppm) in PA extracts from tobacco flowers. e Transcript levels of AtANR, GmANR1 and ZmANR1 in tobacco plants expressing PAP1, PAP1 with AtANR, PAP1 with GmANR1, and PAP1 with ZmANR1. Data are presented as mean ± S.D. (n = 3, independent biological replicates).Asterisks indicate significant difference relative to the untransformed control at P < 0.01 as determined by Student’s t-test. Transcripts not detected are labeled as n.d. NtEF1α was used as the reference gene. Source data for Fig. 1a and Fig. 1e are provided in the Source Data file.

