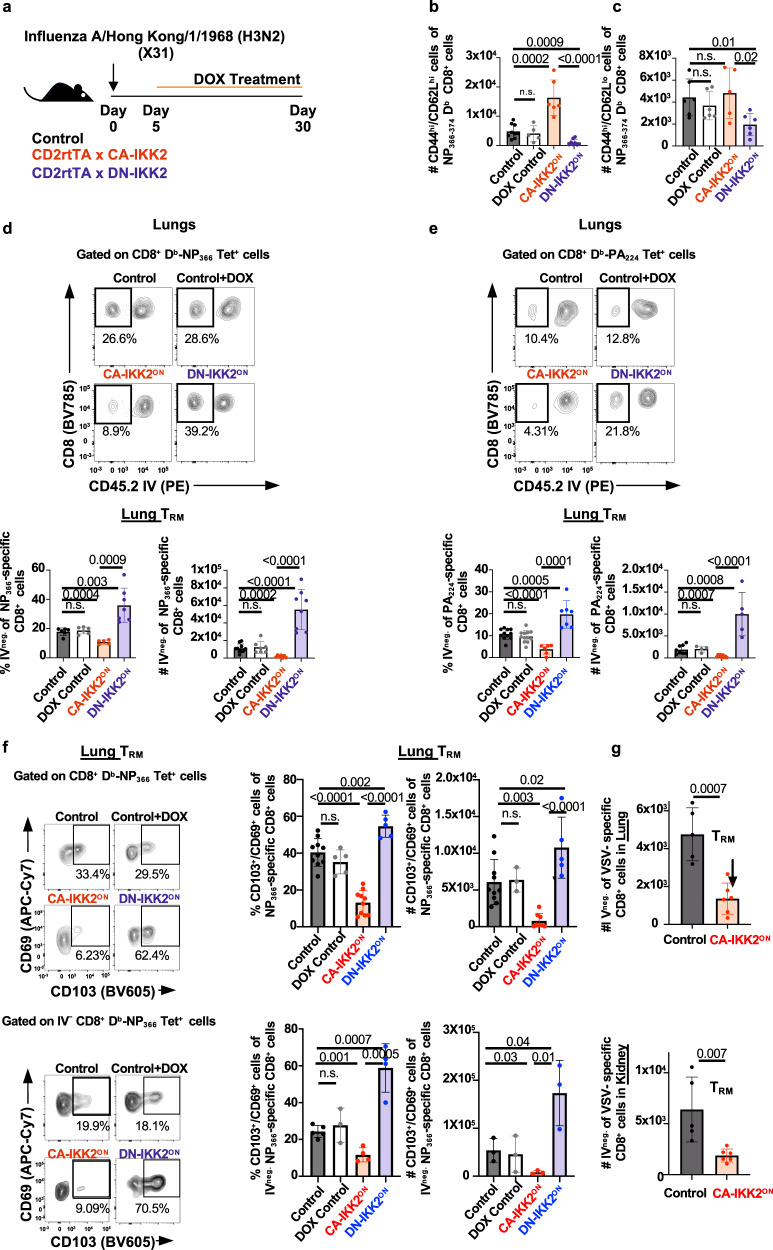
Fig. 1. NFkB signaling differentially regulates T cell memory subset diversity.
a Control, CD2rtTA x CA-IKK2 or CD2rtTA x DN-IKK2 mice were infected with influenza X31(1000 pfu). From 5–30 days post-infection (d.p.i.), mice were fed a DOX or a control diet. Numbers (#) in mediastinal lymph nodes at 30 d.p.i of (b) NP366–374-specific CD44hi, CD62Lhi TMEM cells (CD8+, Db-NP-tet+, CD44+, CD62L+), n = 9 (control), n = 5 (DOX control), n = 6 (CA-IKK2ON), n = 8 (DN-IKK2ON) mice pooled from 3 independent experiments (c) NP366–374-specific CD44hi, CD62Llo (CD8+ Db-NP-tet+ CD44hiCD62Llo) TMEM cells. n = 6 (control), n = 6 (DOX control), n = 5 (CA-IKK2ON), n = 6 (DN-IKK2ON) mice pooled from 4 independent experiments. (d–g) Lung TRM were identified in X31-infected mice by intravascular (IV) staining with CD45.2 to discriminate vascular (IV. CD45.2+) and parenchyma resident (IV CD45.2−). The frequency (%) and numbers of influenza (d) NP366–374 specific CD8+ TRM. For %, #: n = 6, 10 (control), n = 6, 7 (DOX control), n = 5, 7 (CA-IKK2ON), n = 7, 8 (DN-IKK2ON) mice pooled from 2 independent experiments. e PA224–233 specific CD8+ TRM. n = 11, 8 (control), n = 12, 4 (DOX control), n = 6, 9 (CA-IKK2ON), n = 7, 5 (DN-IKK2ON) mice pooled from 2 independent experiments. f Representative dot plots showing frequencies and numbers of cells with the CD69+, CD103+ phenotype among NP366–374 specific CD8+ T cells (top graphs) or among IV negative (bottom graphs). For %, #: n = 10, 10 (control), n = 5, 3 (dox control), n = 10, 8 (CA-IKK2ON), n = 5, 5 (DN-IKK2ON) mice pooled from n = 2 independent experiments for top graphs. n = 5, 3 (control), n = 3, 3 (DOX control), n = 4, 3 (CA-IKK2ON), n = 4, 3 (DN-IKK2ON) mice pooled from 2 independent experiments for bottom graphs. g Control or CD2rtTA x CA-IKK2 (CA-IKK2ON) mice were infected with 2 × 10⁶ pfu VSV, fed a DOX-containing diet from 5 to 30 d.p.i. At 30 d.p.i. VSV-specific CD8+ TRM (Kb-N-tet+ CD8+ CD45.2−) were identified in the lungs and kidneys of infected mice by IV staining. n = 5 (control), n = 6 (CA-IKK2ON) mice pooled from 2 independent experiments. Bars represent mean values ± SD. P-values were determined by a two-tailed unpaired t test, n.s. not significant. Source data provided as a source data file.

