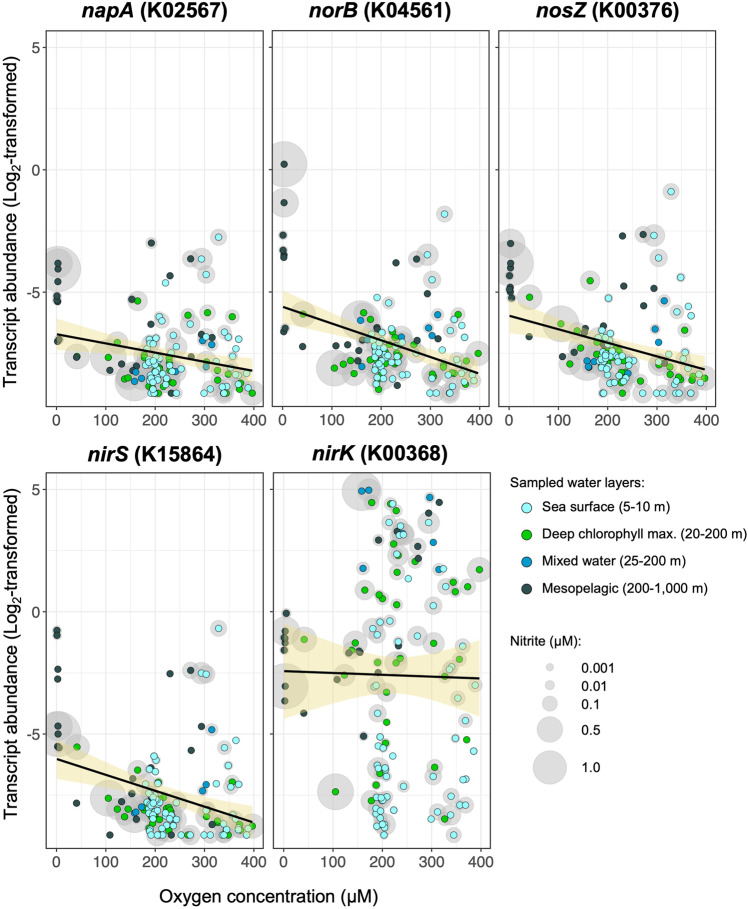
Fig. 5. Expression of nirK in oxygenated marine environments.
Transcript abundances of selected denitrification genes (napA, norB, nosZ and nirS) decreased with increasing oxygen concentrations. In contrary, transcript abundances of nirK were frequently high in phytoplankton-rich water layers (represented by the deep chlorophyll maximum, green dots) in which oxygen levels of 100–400 µM were detected, likely produced by phytoplankton. In the same samples, nitrite levels of up to 1.5 µM were measured. Transcript abundances were fit with a linear regression model (black line) and a 95% confidence interval (yellow shade). Mixed water layer samples originated from the epipelagic region but could not be classified to the surface or deep chlorophyll maxima. Nitrite concentrations <0.001 µM are not shown. In brackets: KEGG orthologous group; napA: periplasmic nitrate reductase; norB: nitric oxide reductase subunit B; nosZ: nitrous-oxide reductase; nirS: nitrite reductase (NO-forming) / hydroxylamine reductase; nirK: nitrite reductase (NO-forming). Data adapted from Salazar et al., 2019 [67], see Table 5.

